

Introduction: Off-Highway Plastics Market Size Estimation Methodology

This methodology explains how the global off-highway plastics market is sized and forecast across major equipment types (construction, agriculture, mining, forestry, and industrial off-road machines). “Off-highway” here means equipment primarily designed for non-public-road operation, where plastics must withstand vibration, mud/dust ingress, UV exposure, chemicals, and wide temperature swings.
The approach combines secondary research (published sources such as OEM filings, trade data, and standards), primary research (structured interviews with OEM and supplier experts), and two complementary sizing paths: bottom-up (unit-level plastics per machine multiplied by production) and top-down (starting from broader plastics/mechanical equipment totals and allocating to off-highway). Outputs are reconciled using data triangulation (cross-checking multiple independent datasets).
Authoritative context sources used to anchor assumptions include publicly accessible industry and standards references such as the International Organization of Motor Vehicle Manufacturers (OICA), the International Organization for Standardization (ISO), and the European Chemicals Agency (ECHA) REACH regulation pages.
TL;DR: We size the market by combining published data and expert interviews, then validate results by comparing bottom-up (parts-per-machine) and top-down (macro allocation) estimates.
Research Design and Overall Approach (What We Measure and How)
The study is designed to produce market size in value (USD) and volume (typically kilotons, kt) for plastics used in OEM-built off-highway equipment. The core workflow is:
- Scope lock: define included equipment, components, and polymer families; list exclusions (see “Market Definition, Boundaries & Exclusions”).
- Build the demand model: estimate plastics content per machine by equipment type and component group, then multiply by regional production/shipments.
- Build the supply/value model: map resin-to-compound-to-part pricing, and validate with supplier/OEM procurement inputs.
- Normalize & reconcile: align currencies, units, base year, and resolve data conflicts; then triangulate top-down and bottom-up results.
- Forecast: apply scenario assumptions tied to construction/infrastructure cycles, farm income and mechanization, mining capex, and electrification.
To make the model tangible, we use order-of-magnitude “reality checks.” For example, plastics content can vary widely by machine class and design philosophy: a compact tractor may carry tens of kilograms of plastics (panels, ducts, reservoirs), while large construction equipment can carry 100+ kg across fenders, engine covers, HVAC (heating, ventilation, and air conditioning) ducting, wire protection, and fluid handling parts. These ranges are used as bounds rather than proprietary inputs.
TL;DR: We translate “machines built” into “plastics consumed” using per-machine plastics ranges, then reconcile with supplier pricing and macro-level totals.
Primary and Secondary Research for Off-Highway Plastics

We use secondary sources to establish baseline production, technology, and regulatory context, then primary interviews to validate plastics content, substitution trends, and price bands by polymer and process.
Secondary Research (Sources and Off-Highway-Specific Inputs)
Secondary research focuses on measurable, off-highway-relevant inputs such as equipment production/shipments, regulatory timelines, polymer trade flows, and public OEM sustainability or lightweighting statements. Typical sources include:
- OEM and Tier supplier disclosures: annual reports, investor decks, and sustainability reports to identify product platforms, materials focus, and regional demand signals.
- Standards and regulatory references: ISO standards for plastics testing and chemical compliance frameworks such as REACH (Registration, Evaluation, Authorisation and Restriction of Chemicals) and RoHS (Restriction of Hazardous Substances) where electronics and harness components are relevant.
- Trade and macro indicators: infrastructure and construction outlooks, commodity cycles, and public production indicators used to stress-test regional demand.
- Industry associations and standards bodies: e.g., ISO for test methods and material specifications context; these inform typical validation requirements for polymer parts (impact, UV, chemical resistance).
Secondary research is also used to identify “where plastics actually move the needle” in off-highway equipment. For example, in excavators and wheel loaders, plastics growth is often driven by large exterior panels (improved styling + corrosion resistance), HVAC ducts (noise, vibration, harshness management), and fluid reservoirs (coolant, washer, hydraulic/DEF (diesel exhaust fluid) where applicable). In agricultural tractors, growth frequently concentrates in fenders, hoods, cab interior trim, and wire/cable protection for increasing electronics content.
TL;DR: Secondary research anchors the model with published production, standards, and compliance context—then highlights which machine components are the biggest plastics adopters.
Primary Research (Interviews that Validate Plastics Content, Pricing, and Substitution)

Primary research fills gaps that public sources rarely cover—especially plastics content per platform, resin selection rationale, and process choice (e.g., injection molding vs. rotational molding). Interviews are structured and role-specific, typically spanning:
- OEM stakeholders: materials engineering, purchasing, platform engineering (cab/interior, exterior, under-hood), and supplier quality teams.
- Material suppliers and compounders: polymer producers, compounders (additive and fiber-reinforced grades), and masterbatch suppliers.
- Processors/part makers: injection molders, blow molders, rotational molders, extruders, and thermoformers serving off-highway programs.
- Testing and compliance stakeholders: validation labs and quality teams familiar with ISO-based test protocols and OEM-specific specifications.
Interview guides focus on practical, quantifiable inputs such as:
- Typical polymer choices by component (e.g., PP (polypropylene) for trims; PA (polyamide/nylon) for under-hood housings; ABS (acrylonitrile butadiene styrene) for interior parts where appropriate).
- Process selection drivers (tooling cost, surface finish requirements, impact/temperature needs, and cycle times).
- Price band sanity checks by resin family and compounded grade (directional confirmation rather than proprietary quotes).
- Qualification requirements such as thermal cycling, chemical resistance (oil/hydraulic fluid), UV/weathering, and impact testing aligned to OEM specs and ISO methods.
TL;DR: Primary interviews verify per-part plastic usage, resin/process choices, and realistic qualification/testing expectations that drive adoption.
Market Definition, Boundaries & Exclusions (What’s In/Out)
Included: plastics (polymers and compounded plastics) used in OEM-installed parts for off-highway equipment—construction machinery (e.g., excavators, loaders), agricultural machinery (tractors, harvesters), mining equipment (haul trucks, underground loaders), forestry equipment, and industrial off-road/material-handling machines designed primarily for off-road use.
Included plastics applications: exterior panels (hoods, fenders), cab interior trim, HVAC ducting, reservoirs and tanks (where plastic is used), electrical housings/connectors, cable conduits, protective covers/guards, and selected functional under-hood components.
Explicitly excluded to keep scope sharp:
- On-road vehicles (passenger cars, on-highway trucks, buses) even if used in industrial settings.
- Aftermarket accessories not tied to OEM production (e.g., cosmetic add-ons sold independently), unless they are OEM-specified/installed in factory builds.
- Non-plastic composites where the polymer is not the primary matrix or where the product is better classified as a composite market (e.g., certain carbon-fiber structural systems), unless explicitly counted as polymer-based plastics components within the study definition.
- Consumables (lubricants, fluids) and non-component packaging materials.
TL;DR: We cover OEM plastics used in off-highway machines and exclude on-road vehicles, non-OEM aftermarket add-ons, and non-plastic composite markets to avoid category blur.
Applications of Plastics in Off-Highway Equipment (Where Demand Concentrates)
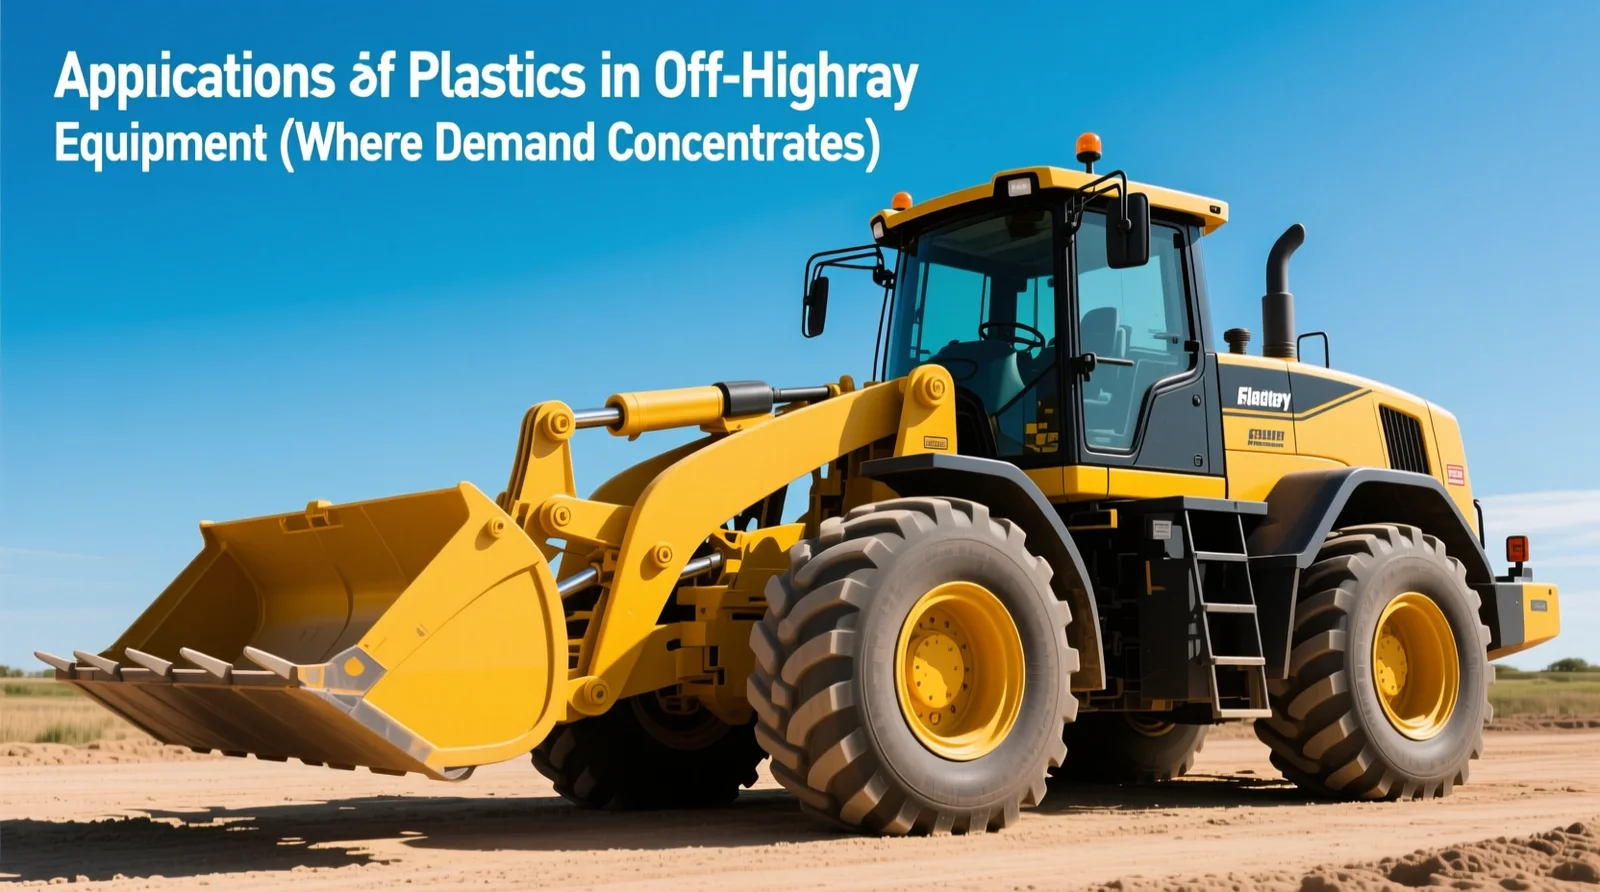
Plastics demand in off-highway equipment is not evenly distributed—it clusters in parts where plastics provide clear advantages over metals: corrosion resistance, styling freedom, integrated functions, and weight reduction that supports fuel efficiency and electrification.
- Construction equipment: engine covers/hoods, fenders, steps/guards, HVAC ducts, electrical housings, and fluid reservoirs. For example, a redesign from multi-piece metal covers to molded plastic panels can cut part count and improve service access, increasing adoption on high-volume excavator and loader platforms.
- Agricultural machinery: large exterior panels and cab interiors benefit from UV-stabilized materials; wiring protection grows as precision-ag electronics expand.
- Mining/forestry: demand centers on heavy-duty guards, cable protection, and housings where impact and chemical resistance matter; materials often require robust validation for abrasion, impact, and temperature extremes.
As an illustrative vignette: in mid-size tractors, many OEMs have shifted from painted steel fenders and hood subassemblies toward polymer-based modules to reduce corrosion issues and simplify assembly—especially in regions with high humidity, fertilizer exposure, and frequent washing. The adoption is typically tied to UV/weathering qualification and scratch resistance targets, not just cost.
TL;DR: The biggest plastics “hot spots” are exterior panels, ducts, housings, and reservoirs—parts where corrosion resistance, integration, and weight reduction pay back in real operating conditions.
Off-Highway Plastics Market Size Estimation (Bottom-Up + Top-Down, Without the Repetition)
We estimate market size using two complementary methods and reconcile them. This reduces single-source bias and highlights where assumptions are driving results.
Bottom-Up Model (Equipment Production × Plastics Content × Price)
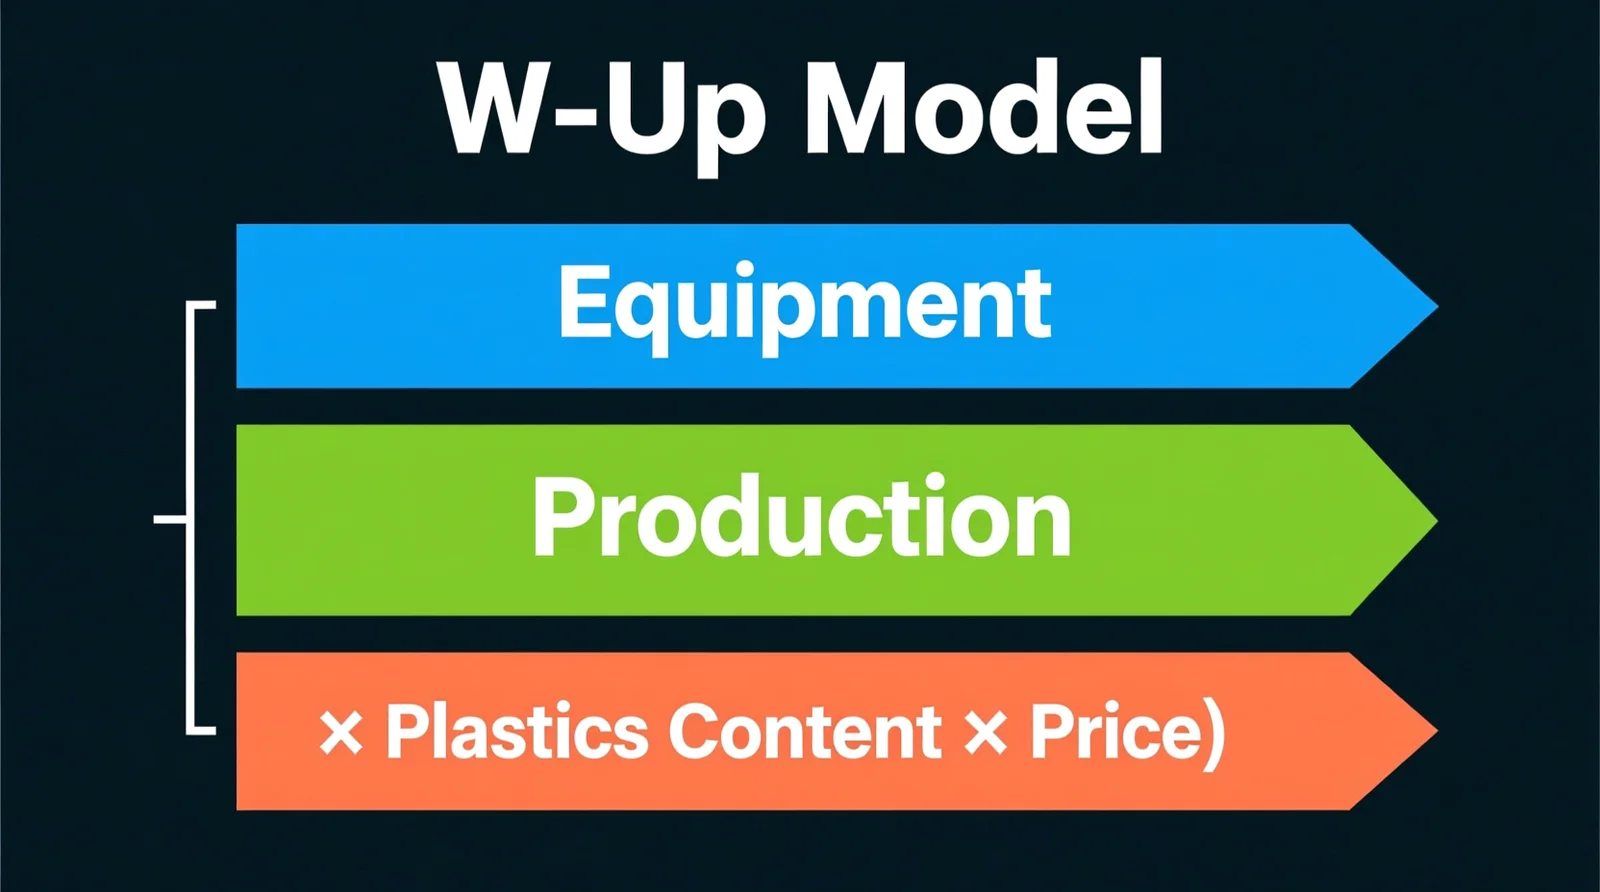
The bottom-up model starts with equipment types and builds upward:
- Step 1: Define equipment categories (e.g., excavators, wheel loaders, bulldozers, tractors, harvesters, mining haul trucks).
- Step 2: Estimate plastics content per machine using component “buckets” (exterior panels, cab/interior, under-hood, electrical protection, reservoirs). Typical ranges are used as guardrails (e.g., tens of kg for smaller agricultural equipment; ~100 kg or more for larger construction machines depending on panel strategy and cab content).
- Step 3: Multiply by regional production/shipments and adjust for platform mix (compact vs. large class machines).
- Step 4: Convert volume (kg/kt) to value using validated price bands by resin family and processing route (injection, blow, rotational, extrusion, thermoforming).
This method makes it clear how inputs translate into outputs: if an excavator platform redesign increases plastic exterior panel mass by, say, low double-digit kilograms per machine, the model shows the direct volume increase after multiplying by annual build volumes and regional mix.
TL;DR: Bottom-up sizing ties demand to “plastics per machine” and machine production—making adoption shifts and platform redesigns visibly impact totals.
Top-Down Model (Macro Plastics/Equipment Totals → Off-Highway Allocation)
The top-down model starts from broader plastics and industrial equipment context and allocates a share to off-highway applications:
- Use published plastics and industrial manufacturing indicators as boundary conditions.
- Allocate to off-highway using validated shares informed by equipment production patterns, OEM portfolio exposure, and trade indicators.
- Distribute by region based on equipment build intensity and end-market drivers (construction spending, mechanization, mining cycles).
Where available, public reference points from organizations such as OICA and widely cited macro datasets help constrain unrealistic regional splits and ensure the top-down view stays consistent with real production geography.
TL;DR: Top-down sizing prevents the model from over-fitting to part-level assumptions by anchoring results to macro production and regional structure.
Data Triangulation, Conflict Resolution & Data Quality Treatment

Triangulation is not just “averaging.” We explicitly manage common market data issues:
- Missing data: if a region lacks reliable production detail for a niche equipment class, we interpolate using correlated indicators (e.g., construction output, machinery imports/exports, or OEM footprint) and confirm directionality in interviews.
- Conflicting sources: when two sources disagree (e.g., trade volumes vs. reported shipments), we prioritize the source closest to the transaction being measured (OEM build/shipments for demand; supplier sales for resin flow), then document adjustment logic.
- Outlier handling: we flag unusually high plastics-per-machine claims and test them against bill-of-material logic (part count, thickness, and realistic component coverage).
- Unit alignment: normalize all volumes to consistent units (kg/kt) and ensure process yields/scrap assumptions are not double-counted when moving from resin to part demand.
Segment splits (material, process, end-use, region) are only finalized after the bottom-up and top-down totals converge within an acceptable tolerance and after at least one demand-side and one supply-side validation pass.
TL;DR: We systematically handle missing/conflicting data and only finalize segment splits after reconciling demand-side and supply-side views.
Base Year, Currency Normalization, Forecast Horizon & Scenario Assumptions
To keep estimates comparable across regions and time:
- Base year selection: choose a recent year with the best combination of reported OEM activity and stabilized supply chains (explicitly stated in the final report). If a year contains abnormal disruptions, we adjust using multi-year smoothing rather than letting a single shock set the baseline.
- Currency normalization: market values are expressed in USD; non-USD financials are converted using average annual exchange rates for the base year and applied consistently across the dataset. Inflation effects are handled via stated assumptions (nominal vs. real terms, depending on reporting convention).
- Forecast horizon: typically a mid-term horizon (commonly 5–7 years) to reflect platform redesign cycles, tooling investment timelines, and regulatory ramp periods.
- Scenario design: at minimum, a conservative and an aggressive scenario are run. Conservative scenarios assume slower infrastructure spend and delayed fleet replacement; aggressive scenarios assume stronger infrastructure investment and faster adoption of electrified/connected platforms that add housings and cable protection demand.
Growth rates are expressed as CAGR (compound annual growth rate)—the smoothed annual growth rate over the forecast period. For realism, we test output CAGRs against plausible equipment-cycle behavior (construction and mining are typically more cyclical than agriculture) and against material substitution lead times.
TL;DR: We standardize currencies and baseline year, use a practical 5–7 year horizon, and run conservative/aggressive scenarios tied to infrastructure and equipment-cycle assumptions.
Standards, Regulations & Validation Requirements (E-E-A-T Enhancers)
Off-highway plastics adoption is constrained by real qualification gates, not just cost. The study reflects how standards and regulations influence material choice:
- Chemicals compliance: REACH in the EU governs chemical substance restrictions and reporting obligations (ECHA REACH overview). For electrical/electronic components, RoHS restrictions are often relevant to materials and additives selection.
- Testing & material performance: OEM validation commonly includes UV/weathering, thermal aging, impact testing, chemical resistance (oils, fuels, hydraulic fluids), and vibration/fit durability—often aligned to ISO-based methods and OEM internal specifications. ISO’s standards catalog provides the backbone for many test-method references (ISO Standards).
- Emissions and powertrain shifts: tighter emissions norms and the move toward electrified equipment can change plastics demand mix (more cable protection, housings, and thermal-management adjacent parts). For regulatory context on non-road engines, readers often reference frameworks such as the U.S. EPA nonroad engine regulations.
TL;DR: Compliance (REACH/RoHS) and validation testing (UV, impact, chemical, thermal) are practical adoption gates; emissions/electrification trends reshape which plastic parts grow fastest.
How Decision-Makers Use This Methodology Output (OEMs, Suppliers, Investors)
The deliverables are structured for practical actions—not just market sizing:
- OEMs: benchmark plastics penetration by machine class, identify high-ROI substitution targets (e.g., exterior modules, reservoirs), and align sourcing strategy with regional build plans.
- Material suppliers & compounders: prioritize grade development (UV-stabilized PP, heat/chemical-resistant PA, impact-modified blends), plan qualification roadmaps, and size regional capacity needs by process (injection vs. rotomolding vs. blow molding).
- Processors/part makers: decide tooling and capacity investments around equipment-cycle timing and the most scalable component families (panels, ducts, housings).
- Investors/strategy teams: evaluate which segments are structurally growing (e.g., electrification-driven housings) versus cycle-driven (construction upswings), and stress-test returns under conservative/aggressive scenarios.
TL;DR: The output supports portfolio prioritization, capacity planning, and regional go-to-market choices—tailored to what OEMs, suppliers, and investors actually decide on.
AI and Generative AI (GenAI) Impact on Off-Highway Plastics: Concrete Use Cases

AI (artificial intelligence) and GenAI (generative AI) are increasingly used to shorten design cycles and reduce prototyping costs in plastics-heavy assemblies:
- Generative design for lightweighting: engineers can use generative design workflows to redesign a plastic engine cover or hydraulic reservoir bracket/guard by exploring ribbing patterns and thickness distributions that maintain stiffness while reducing mass. The market impact shows up as higher adoption of engineered plastics and optimized geometries that reduce material per part while expanding plastics to additional components (net effect depends on platform strategy).
- Machine learning for regional demand forecasting: ML models can predict demand by equipment type (e.g., excavators vs. tractors) using leading indicators such as construction activity, commodity price trends, and OEM backlog signals—improving inventory positioning for resin, compounds, and molded parts.
In the market research workflow itself, AI can assist with faster document classification (e.g., extracting polymer mentions and capacity signals from filings), but human validation remains essential due to inconsistent terminology and differing definitions across regions.
TL;DR: GenAI can reshape component design (lighter, fewer parts) and ML can sharpen regional demand forecasts—both influencing where plastics volumes and value concentrate.
Conclusion: Transparency, Assumptions & Limitations
This off-highway plastics market methodology combines equipment-level plastics content modeling with macro-level allocation and then reconciles both through triangulation and expert validation. It is designed to reflect how plastics are actually specified, tested, and qualified in harsh-duty equipment—not just how they appear in aggregated polymer statistics.
Key assumptions typically include stable definitions of equipment classes, reasonable plastics-per-machine ranges by platform, and scenario-based macro drivers (infrastructure spending, farm mechanization, mining capex, and electrification pace). Limitations include reliance on expert estimates where public data is sparse (especially in emerging markets), sensitivity to macroeconomic shocks (construction/mining cycles), and the fact that OEM material strategies can change quickly with platform refreshes, supplier localization, or regulatory shifts.
TL;DR: The method is practical and validation-driven, but outcomes remain sensitive to data gaps, cycle swings, and platform redesign timing—so assumptions and scenarios are made explicit.
FAQ

Q: What counts as “off-highway plastics” in this market definition?
A: It includes polymers and plastic components installed by OEMs in off-highway equipment (construction, agriculture, mining, forestry, and industrial off-road machines). It excludes on-road vehicles, non-OEM aftermarket accessories, and non-plastic composite markets unless explicitly defined as polymer-based plastic components within the scope.
Q: How do you estimate plastics content per excavator or tractor without proprietary bills of materials?
A: We use component “buckets” (panels, cab/interior, under-hood, electrical protection, reservoirs) and validate realistic kg-per-machine ranges via interviews with OEM engineers, procurement teams, compounders, and processors. Outliers are tested against part-count and manufacturability logic, then reconciled against production and supplier sales indicators.
Q: Which plastic materials are most common in off-highway equipment applications?
A: Common families include PP (polypropylene) for trims and panels, PE (polyethylene) for certain ducts and tanks, PA (polyamide/nylon) for heat/chemical-resistant housings, and ABS (acrylonitrile butadiene styrene) for selected interior applications. Final selection depends on UV exposure, temperature, chemical contact, and impact requirements.
Q: How do regulations like REACH or RoHS affect off-highway plastics demand?
A: They influence allowable additives and material formulations, especially for electrical/electronic components and any parts with restricted substances. Compliance can accelerate reformulation, shift demand toward compliant grades, and add qualification work—factors reflected in adoption timing and cost assumptions. See ECHA REACH and the EU’s RoHS Directive overview for reference.
Q: How can OEMs and suppliers use the forecast scenarios in practice?
A: OEMs can align platform redesign and sourcing strategies to conservative/aggressive demand cases, while suppliers can plan capacity and qualification priorities by region and process (injection vs. blow vs. rotational molding). Investors and strategy teams can stress-test growth expectations against construction/mining cycles and electrification adoption rates.