Introduction: Global Heavy Construction Equipment Market Size, CAGR, Regional Outlook, and Key Manufacturers
The global heavy construction equipment market size continues to expand as governments and private owners fund roads, rail, ports, energy transition assets, and urban redevelopment. Over the next decade, purchasing decisions will increasingly hinge on total cost of ownership (TCO) (the full lifecycle cost: purchase, fuel/energy, maintenance, downtime, and resale), compliance with non-road mobile machinery emissions regulations, and productivity gains from construction equipment telematics adoption (connected systems that transmit machine location, utilization, and health data).
On market sizing, IMARC Group estimates the heavy construction equipment market at USD 144.7 billion in 2024, forecasting USD 214.5 billion by 2033 at a 4.25% CAGR (2025–2033). To cross-check directional growth and drivers, other industry sources point to similar demand fundamentals tied to infrastructure and fleet replacement cycles, including updates from the Off-Highway Research team (industry specialist in off-highway equipment) and manufacturer/industry reporting tracked through associations such as the Association of Equipment Manufacturers (AEM). Forecast differences between providers typically reflect scope (whether compact equipment is included), base year assumptions (2023 vs. 2024), and methodology (top-down macro + OEM shipments vs. bottom-up fleet/activity models).
Competitive dynamics remain concentrated among global OEMs (original equipment manufacturers) with scale in engines, hydraulics, dealer coverage, and financing. In most regions, Caterpillar, Komatsu, Volvo CE, Hitachi Construction Machinery, John Deere, Liebherr, JCB, SANY, XCMG, and Zoomlion anchor the top tier. Differentiation increasingly comes from (1) integrated digital ecosystems (telematics + fleet portals + service), (2) electrification roadmaps, and (3) partnerships in autonomy, batteries, and charging.
TL;DR: The market outlook is anchored by infrastructure and replacement demand; forecasts vary by scope/methodology, and competition is shifting toward digital service ecosystems, electrification pathways, and stronger dealer/service networks.
Market Segmentation Snapshot (Equipment Type, Application, and Region)
A clearer segmentation helps explain where growth (and technology disruption) is most pronounced:
- By equipment type: excavators (crawler/wheeled), wheel loaders, dozers, motor graders, articulated dump trucks (ADTs), rigid trucks, cranes, pavers, rollers/compactors, and material handlers.
- By application segment: construction (residential/commercial), infrastructure (roads/rail/ports/airports), mining & quarrying, and industrial (plants, logistics, energy).
- By region: North America, Europe, Asia-Pacific, Latin America, and Middle East & Africa.
Technology penetration differs by segment. For example, grade control (automated blade/bucket positioning using GNSS—Global Navigation Satellite System) is common in dozers and graders on road projects, while electric excavators market momentum is strongest in compact-to-mid classes operating in urban low-noise/low-idle conditions.
Data visualization opportunity: Add a simple matrix table: Equipment type (rows) vs. technology trends (columns: electrification, telematics, automation, safety systems). This quickly shows which categories are most affected.
TL;DR: Segmenting by equipment type, application, and region explains why electrification leads in compact/mid equipment, while automation and telematics scale fastest in earthmoving fleets tied to infrastructure and mining.
Heavy Construction Equipment Market Growth Drivers

Infrastructure Spending and Fleet Replacement Cycles
Large public programs keep equipment utilization high, but the more durable driver is often fleet replacement: contractors and rental houses retire older units when uptime risk and fuel burn become too expensive relative to newer machines with better hydraulics, aftertreatment, and digital maintenance planning.
In India, national highway expansion plans continue to pull demand for excavators, graders, pavers, and compactors. In the U.S., multi-year federal funding supports road/bridge rehabilitation and resilience work; the Federal Highway Administration (FHWA) Bipartisan Infrastructure Law page outlines funding categories and program structure (useful context for project pipelines).
Stakeholder impact: contractors prioritize delivery schedules and uptime; rental companies prioritize standardized specs and serviceability; OEMs prioritize lead times and dealer parts fill rates; financiers prioritize residual value stability in a slower/stronger cycle.
TL;DR: Infrastructure pipelines matter, but replacement economics (uptime, fuel, service, residual value) often determine when fleets modernize.
Construction Equipment Telematics Adoption and Automation (From “Nice-to-Have” to Operating Standard)

Telematics (onboard hardware + connectivity that streams machine data) is now central to fleet decisions because it converts equipment from a “black box” into a measurable asset. Typical outcomes for disciplined users include lower idle time, fewer surprise failures, and better asset utilization—especially for mixed fleets spread across multiple sites.
While results depend on workflow maturity, industry field experience commonly reports mid-single-digit to low-double-digit fuel savings when idle reduction and operator coaching are sustained (often cited in the ~5–15% range for fuel/idle-related improvements on diesel fleets, varying by duty cycle). Predictive maintenance also reduces costly downtime by catching issues earlier (e.g., abnormal temperatures/pressures, filter restriction, DPF—diesel particulate filter—regeneration problems).
Mini case example (measurable outcome pattern): On large earthworks packages (high machine hours, repeatable cycles), contractors using machine guidance + telematics typically report fewer rework passes and tighter grade accuracy. The measurable KPI improvement is often seen in pass count reduction, schedule adherence, and lower fuel per cubic meter moved—benefits that compound on multi-month projects where every percentage point of efficiency matters.
Competitive dynamic: OEMs differentiate by how “open” their digital stack is. Some push vertically integrated portals tied to dealer service; others emphasize APIs (application programming interfaces) and partnerships so customers can aggregate mixed-fleet data into one dashboard. Partnerships with grade-control providers and connectivity platforms have become a practical differentiator as fleets rarely remain single-brand.
TL;DR: Telematics and automation pay off when tied to disciplined processes (idle control, maintenance planning, grade workflows), and OEM differentiation increasingly depends on how well their digital ecosystem works in mixed fleets.
Heavy Equipment Rental Trends and Flexible Financing
Heavy equipment rental trends favor higher utilization, faster technology refresh, and risk transfer (maintenance, resale exposure) away from contractors—especially when project pipelines are uneven. Rental houses also influence OEM product design by demanding simplified controls, faster service access, and durable components that withstand varied operators.
OEM initiatives aimed at rental fleets (e.g., rental-focused spec packages and simplified HMIs—human-machine interfaces) are not just marketing; they are a response to rental economics where turn time, damage resistance, and service intervals directly affect ROI.
Stakeholder impact: contractors gain flexibility; rental companies push for standardized configurations and stronger telematics for billing/utilization; OEMs expand captive finance and service contracts; lenders evaluate utilization and residuals under different cycle scenarios.
Data visualization opportunity: Add a chart showing rental vs. ownership penetration over time by region (even if indicative), and a second chart showing utilization rate bands (low/medium/high) vs. best-fit acquisition model (own/lease/rent).
TL;DR: Rental growth is driven by utilization economics and faster refresh cycles, and it is reshaping OEM design priorities toward serviceability, durability, and telematics-enabled fleet control.
Key Trends (Short-Term vs. Long-Term Time Horizons)
Short-Term (1–3 Years): Supply Chain Localization and Regional Manufacturing Footprints
After recent disruptions, OEMs have prioritized regional manufacturing and second-source strategies for critical components (hydraulics, electronics, castings). The goal is not only resilience; it also shortens lead times for high-turn models and helps meet local content expectations on public projects.
Examples include Volvo CE’s investment in U.S. capacity expansion in Shippensburg, Pennsylvania, and expanded manufacturing and engineering capabilities in Asia (including India). These moves also support faster configuration for local regulations (lighting, safety, emissions labeling) and customer preferences.
TL;DR: Localization is a near-term response to lead-time and risk management—and it improves responsiveness to region-specific specs and regulations.
Long-Term (3–10+ Years): Electrification, Alternative Fuels, and the Electric Excavators Market
The electric excavators market is growing from compact and mid-size categories upward, but the pace differs sharply by duty cycle and infrastructure readiness. Electrification works best where machines have predictable shifts, access to charging, and high idle time (where electric drivetrains avoid fuel burn and reduce maintenance on engines/aftertreatment).
Regulatory context (why electrification is accelerating):
- EU NRMM (Non-Road Mobile Machinery) rules are governed by Regulation (EU) 2016/1628 with Stage V emissions limits. Summary resources are available via the European Commission NRMM page.
- U.S. EPA Tier standards (Tier 4 Final for many categories) drive aftertreatment adoption and push OEMs toward cleaner solutions; see the U.S. EPA nonroad engines and equipment overview.
- India CPCB (Central Pollution Control Board) norms for construction equipment align with staged tightening (often referenced as Bharat/CEV stages by category); official context is available through the CPCB site.
Practical benchmark (diesel vs. electric TCO): For compact-to-mid equipment on urban duty cycles, electric units can reduce energy cost per hour and cut maintenance related to engines, fluids, and aftertreatment. However, they carry higher CAPEX and require charging planning. In many real-world fleet evaluations, the payback period for electrification is often discussed in the ~3–7 year range depending on annual hours, local diesel/electricity prices, incentives, and battery warranty terms. For heavier classes with high continuous load, the economic case is improving but is still more site-specific and infrastructure-dependent.
Mini case example (electric deployment pattern): Electric compact excavators and wheel loaders are already deployed on indoor demolition, utility trenching, and city-center work where noise restrictions and ventilation constraints are strict. Contractors typically cite measurable benefits in noise reduction, operator comfort, and ability to work extended hours (fewer community complaints) alongside simpler daily maintenance checks.
Competitive dynamic: OEM differentiation in electrification is increasingly about ecosystems—battery supply agreements, charging partners, dealer technician training, and machine-software integration. Some OEMs emphasize tethered/corded solutions for high-utilization stationary work; others focus on swappable batteries for compact fleets; many pursue partnerships to reduce customer risk on charging infrastructure.
TL;DR: Electrification is a long-term structural shift, pulled by Stage V/Tier standards and urban jobsite constraints; payback is often plausible in compact/mid duty cycles but remains site-dependent in heavier classes.
Safety Systems, Remote Operation, and Worksite Intelligence
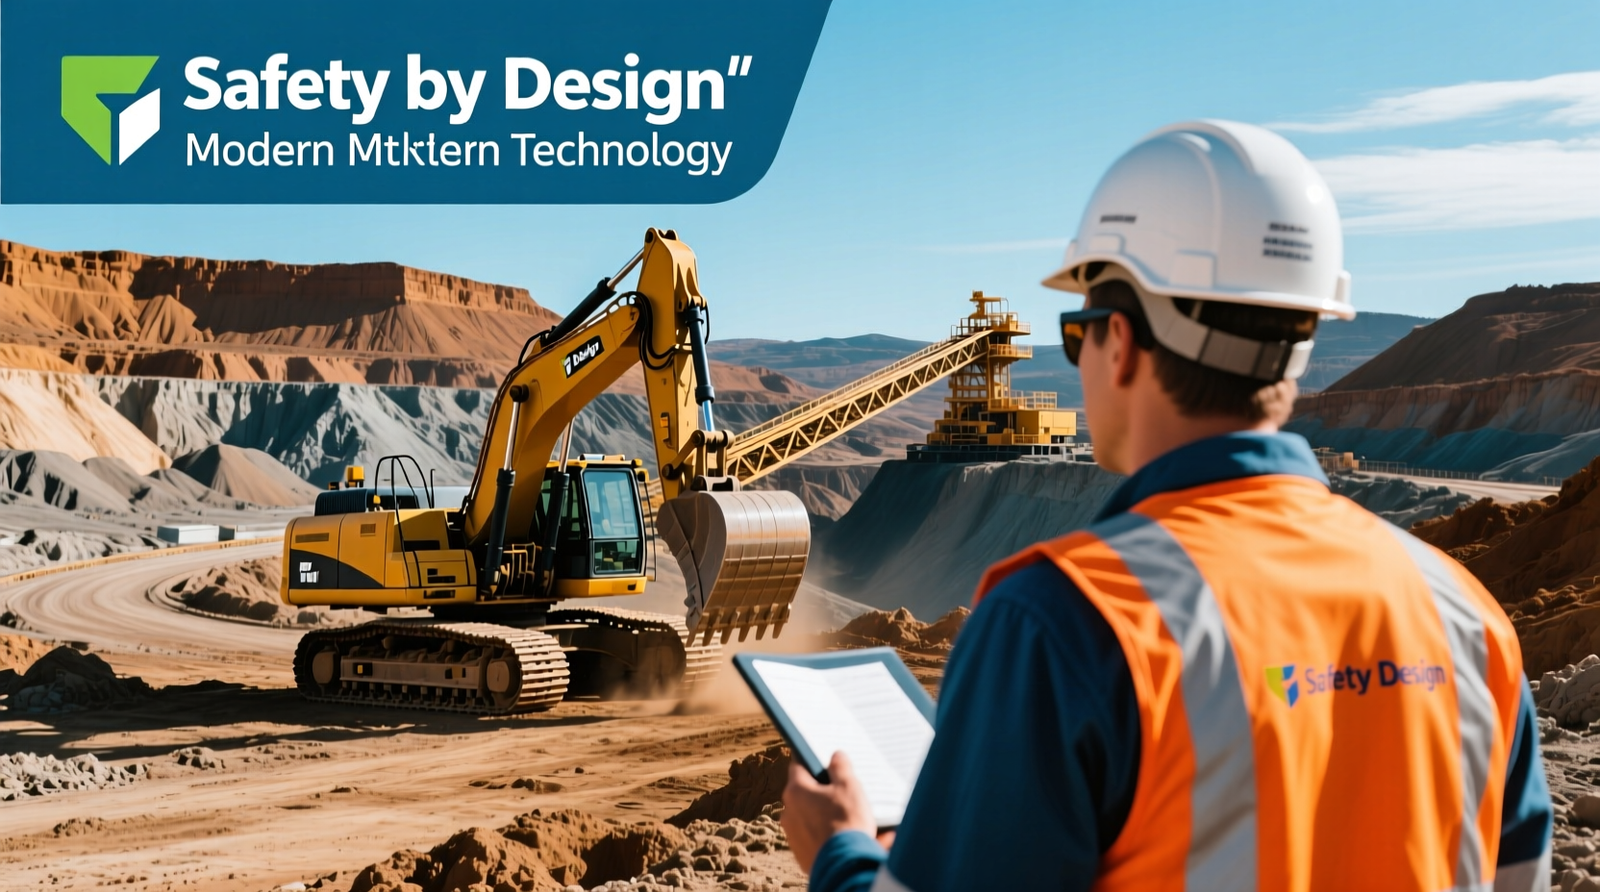
Safety innovation is moving from passive protection to active prevention: camera fusion, radar, proximity detection, and AI-assisted alerts. Remote operation (operator controls machine from a safe station) is expanding in demolition, hazardous earthworks, and select mining applications where incident risk and labor scarcity are high.
Stakeholder impact: contractors reduce incident exposure and schedule disruption; rental companies prefer robust, easy-to-reset systems; OEMs use safety packages to differentiate premium trims; insurers and owners increasingly reward documented safety controls.
TL;DR: Safety tech is increasingly measurable (fewer incidents, less downtime) and is becoming a differentiator in bids, insurance, and operator retention—especially for hazardous or urban sites.
Regional Outlook
North America
North American demand is influenced by public infrastructure funding, energy and industrial build-outs, and replacement cycles for aging fleets. Customers often prioritize dealer coverage, parts availability, and residual value—advantages that favor established OEM networks. Digital service contracts and connected diagnostics are increasingly bundled into financing packages.
TL;DR: North America rewards strong dealer/service networks, connected uptime programs, and predictable resale—especially as public infrastructure work remains a steady demand base.
Europe
Europe’s market is shaped heavily by EU Stage V NRMM compliance, city low-emission expectations, and noise constraints—conditions that accelerate adoption of electric compact equipment and hybrid solutions. Contractors also face tighter reporting requirements on emissions and sustainability, increasing the value of telematics-based reporting.
TL;DR: Europe’s regulatory and urban constraints make it a leading region for low-emission equipment, telematics reporting, and compact electrification.
Asia-Pacific
Asia-Pacific combines high-volume infrastructure growth with intense OEM competition. Domestic champions (notably in China) compete aggressively on price-performance and increasingly on technology, while Japanese, Korean, European, and U.S. OEMs differentiate via reliability, advanced automation, and dealer support. India’s infrastructure pipeline and manufacturing expansion continue to strengthen its role as both a demand center and production hub.
TL;DR: Asia-Pacific is the volume engine, with fierce competition and fast adoption of cost-effective technology; India is rising as both a major buyer and manufacturing base.
Latin America
Latin American demand is closely tied to commodities, quarrying, and infrastructure cycles. Customers often value robust machines that tolerate variable fuel quality and challenging operating environments, plus financing structures that manage currency and cycle volatility.
TL;DR: Latin America’s equipment demand is cyclical and commodity-linked, favoring durable specs and flexible financing with strong service support.
Middle East & Africa
Large-scale civil projects, logistics hubs, and energy investments sustain demand in parts of the Middle East, while Africa’s growth is driven by infrastructure gaps and mining activity in key corridors. Equipment selection often prioritizes cooling capacity, filtration, and easy field service due to heat, dust, and remote sites.
TL;DR: MEA demand is project-driven and environment-intensive, rewarding machines engineered for heat/dust and supported by reliable field service.
Competitive Landscape: How OEMs Win Beyond Horsepower
Performance specs remain important, but purchasing decisions increasingly come down to system-level differentiation:
- Digital ecosystems: OEM telematics portals, mixed-fleet integration, and dealer-connected diagnostics that shorten mean time to repair (MTTR).
- Serviceability design: ground-level access, longer service intervals, easier filter changes, and modular electronics—critical for rental uptime.
- Electrification readiness: real-world availability, battery warranty clarity, charging partnerships, and technician training programs.
- Autonomy partnerships: collaborations with technology providers for perception stacks, site positioning, and remote operations—especially in mining and large earthmoving.
Data visualization opportunity: Add a comparison table listing 6–10 leading OEMs with columns for (1) electrified lineup breadth, (2) telematics maturity, (3) autonomy/remote ops offerings, and (4) rental-focused product strategy.
TL;DR: OEM competition is shifting from machine-only performance to integrated solutions: uptime programs, digital platforms, electrification ecosystems, and automation partnerships.
How Contractors and Fleet Managers Can Prepare (Action Checklist)

- Quantify TCO by duty cycle: model fuel/energy, maintenance, expected downtime, and resale value by machine class (not just purchase price).
- Use telematics with clear KPIs: set targets for idle time, utilization, maintenance compliance, and operator behavior; assign ownership for acting on data.
- Evaluate electrification site-by-site: confirm charging access (power availability, layout, safety), shift patterns, and backup plans for peak days.
- Plan payback realistically: telematics/software initiatives can pay back in months when utilization is high and processes change; electrification commonly requires multi-year horizons (often ~3–7 years) depending on hours and energy prices.
- Choose rental vs. ownership intentionally: rent for specialized/seasonal needs and uncertain pipelines; own when utilization is predictable and you can standardize maintenance and operator training.
- Check regulatory compliance early: confirm engine tier/stage, aftertreatment requirements, and any city low-emission or noise constraints before mobilization.
TL;DR: The best upgrades start with duty-cycle TCO, disciplined telematics KPIs, and site-specific electrification planning—then align acquisition strategy (rent/own/lease) with utilization and pipeline certainty.
Risks, Assumptions, and What Could Change the Forecast
Most 2025–2033 forecasts assume steady infrastructure spending, manageable interest rates, and continued regulatory tightening without abrupt policy reversals. Key upside/downside factors include:
- Downside risks: macro slowdowns, delayed public procurement, commodity price drops affecting mining, supply chain disruptions (electronics), and tighter credit availability.
- Upside risks: faster permitting and stimulus deployment, accelerated fleet replacement due to stricter low-emission zones, and faster cost declines in batteries/charging.
TL;DR: Forecasts rely on infrastructure continuity and manageable macro conditions; swings in credit, commodities, and regulation can materially shift equipment demand and technology adoption rates.
Conclusion
The heavy construction equipment market is being reshaped by three practical realities: (1) owners need higher uptime and predictable costs, (2) regulators are tightening limits on nonroad emissions, and (3) digital tools are now mature enough to change day-to-day fleet decisions. In the near term, supply chain localization and rental-fleet optimization will remain important. Over the longer term, electrification and automation will expand from smaller machines and controlled environments into broader applications as infrastructure and economics improve.
TL;DR: Near-term winners deliver uptime and availability; long-term winners pair compliant powertrains with strong digital ecosystems and service execution.
FAQ
Q: How should contractors evaluate when to replace older fleets with newer, connected machines?
A: Start with a duty-cycle TCO comparison: fuel burn per hour, maintenance and wear costs, unplanned downtime frequency, and expected resale value. If telematics shows high idle time, frequent fault codes, or repeated repairs, newer connected machines often justify replacement through reduced downtime and measurable productivity gains—especially on multi-month infrastructure jobs where delays are costly.
Q: What are the main obstacles to adopting electric heavy equipment and how can they be mitigated?
A: The biggest barriers are charging infrastructure (power availability, layout, safety), higher upfront cost, and uncertainty about runtime on demanding cycles. Mitigation steps include piloting on predictable urban duty cycles, installing staged charging (overnight + opportunity charging), negotiating battery warranty terms, and keeping a mixed fleet where diesel covers peak-load or remote tasks until infrastructure is ready.
Q: What fuel savings can telematics realistically deliver in heavy equipment fleets?
A: Results vary by job type and discipline, but fleets that actively manage idle time, maintenance compliance, and operator behavior often see fuel/idle-related improvements in the mid-single-digit to low-double-digit range. The key is pairing data with action: alerts, coaching, and clear accountability.
Q: How do rental utilization rates affect equipment selection and specification?
A: High-utilization rental fleets prioritize durable components, fast daily inspections, simplified controls, and telematics for utilization tracking and maintenance planning. Lower-utilization or specialty rentals may justify more configurable attachments or premium features, but the core spec still needs to minimize downtime and speed turnaround between customers.
Q: Which emissions rules matter most for heavy construction equipment purchases today?
A: In Europe, EU NRMM Stage V requirements are central; in the U.S., EPA Tier standards (often Tier 4 Final categories) guide engine and aftertreatment specifications; and in India, CPCB-aligned requirements influence what can be sold and operated by category. Contractors should verify compliance for the exact machine class and intended work location before procurement or mobilization.