
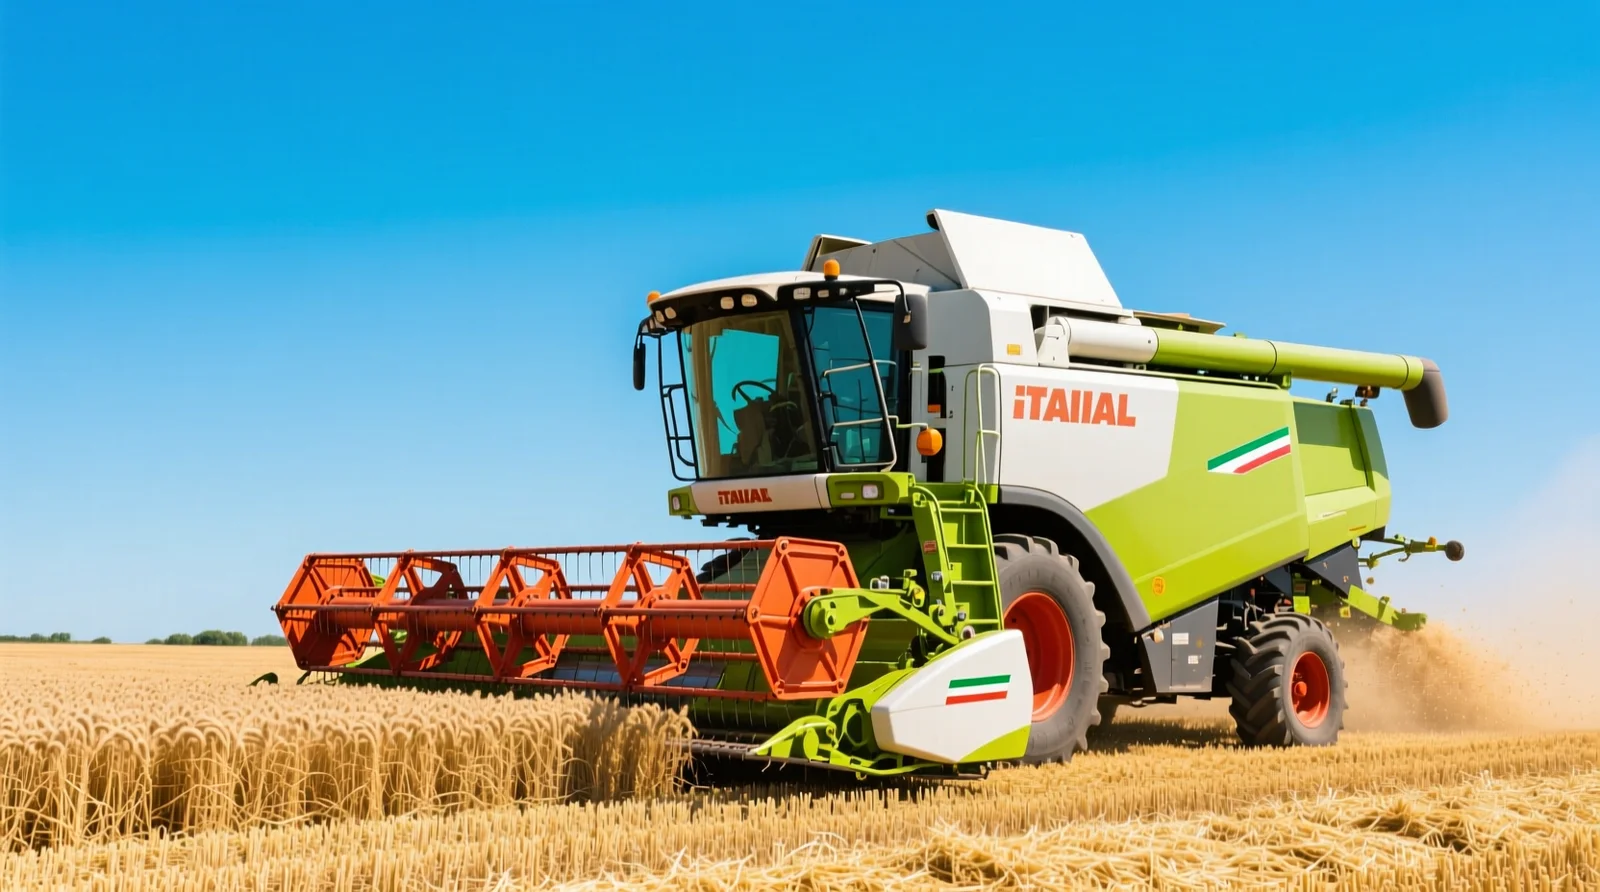
Italy’s agricultural machinery market in 2026 is balancing a domestic rebound—largely supported by incentives for safer, more digital equipment—against tougher export conditions. This analysis explains where growth is coming from, how Italy compares with other leading producers, and how EIMA 2026 Bologna can be used to rebuild export pipelines and accelerate fleet renewal.
Italian agricultural machinery market 2026: domestic recovery drivers and structural constraints
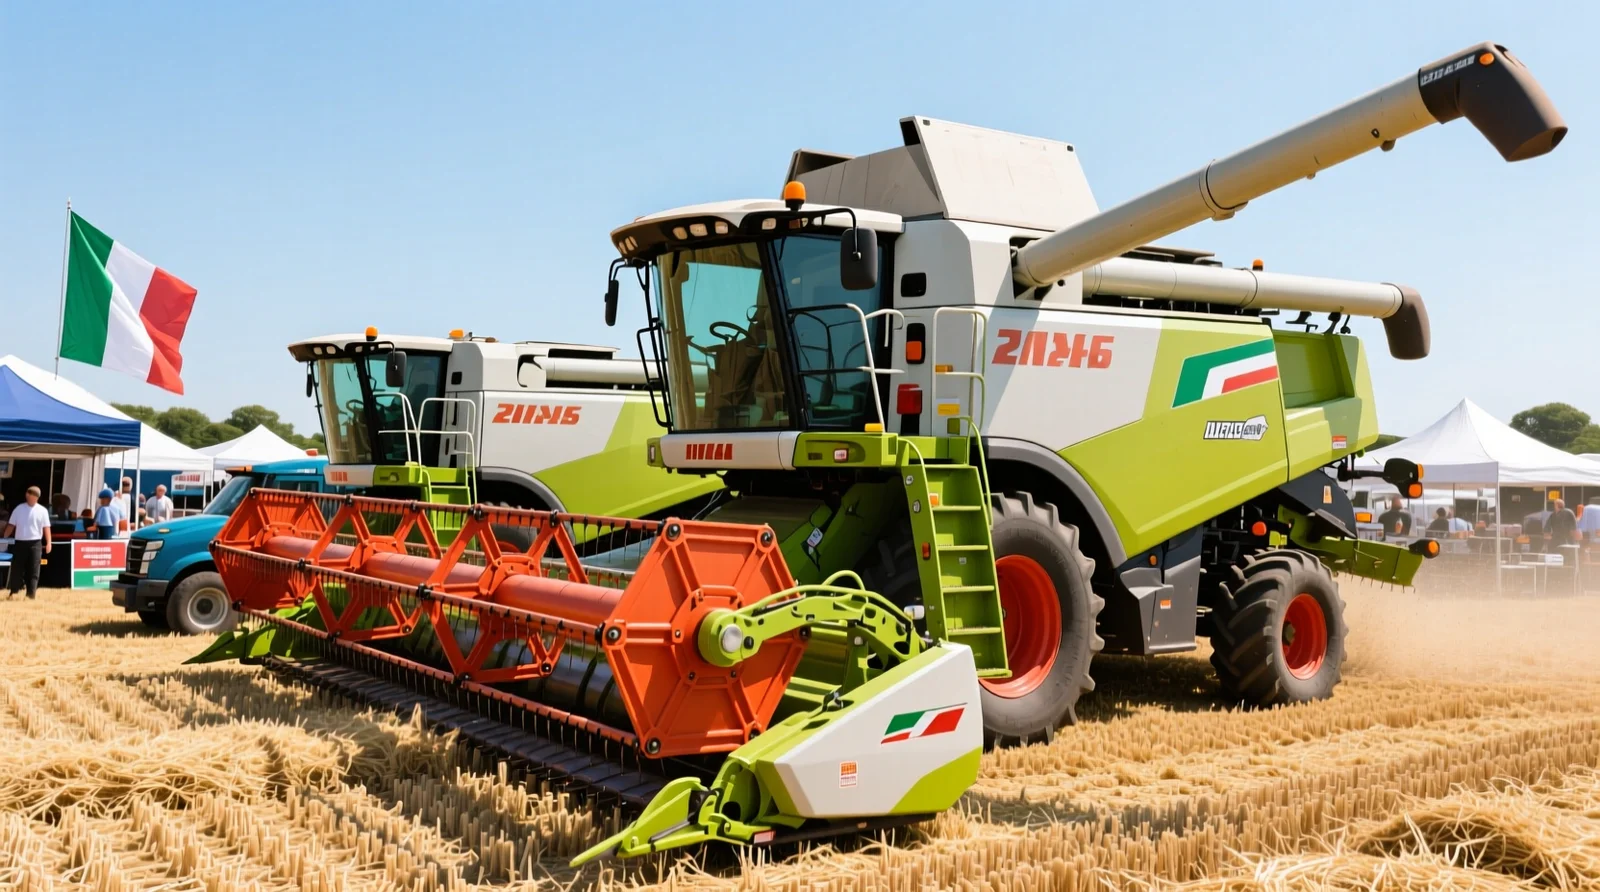
Entering 2026, Italy’s domestic market is improving, but the recovery remains structurally “policy-sensitive.” Industry estimates frequently cited by FederUnacoma indicate that around 70% of sector turnover is export-generated, leaving domestic demand (roughly 30%) unable to fully buffer external shocks. This export dependence is high in European terms and closer to Germany’s export-led machinery model than to the more domestically anchored US market (where scale of domestic farming and procurement cycles often provide a larger home-demand stabiliser).
Interpretation: the domestic upswing matters most as a production smoothing mechanism (keeping plants and dealer networks active) and as a technology adoption engine (connected/low-emission equipment), rather than as the main profit pool for Italian manufacturers.
TL;DR: Italy’s 2026 recovery is real but still cannot offset export volatility because the sector remains structurally export-dependent.
New machinery sales in 2025: what improved and what it signals for 2026 demand
FederUnacoma leadership data presented for 2025 points to a clear rebound in new registrations, with new tractor registrations up +13.7% to about 17,600 units (statement cited in sector communications by FederUnacoma during 2025/early 2026). Interpreting that jump: it typically reflects (1) incentive windows aligning with purchase decisions, (2) replacement of the most failure-prone units after years of deferred investment, and (3) increased interest in precision agriculture (site-specific management using data, sensors, and automation to optimise inputs and operations).
Sub-segment nuance matters:
- Tractors often react fastest to incentives because they are the “platform” purchase enabling multiple implements and because resale markets are liquid.
- Self-propelled machines (e.g., combine harvesters, sprayers) are more cyclical and capital-intensive; they also depend heavily on contractor models and farm size distribution.
- Implements (seeders, tillage, mowers) may grow even when tractors slow, especially when farmers upgrade to conservation practices or precision-ready toolbars.
- Digital solutions (guidance, telematics, farm management software) can scale via retrofits and subscriptions, but adoption depends on skills, connectivity, and interoperability.
TL;DR: 2025’s tractor rebound likely reflects incentive timing and replacement needs; growth differs by segment, with tractors and implements typically more responsive than high-ticket self-propelled machines.
How much of the domestic rebound is “incentive-driven”? A practical attribution model
Italy’s domestic demand in 2025–2026 is widely linked to overlapping measures: ISI/INAIL (INAIL = Italy’s National Institute for Insurance against Accidents at Work; ISI calls fund safety investments), the Industry 4.0 tax credit (incentive for connected/digital capital goods), RDP (Rural Development Programmes under the EU Common Agricultural Policy), and Southern Italy support via ZES (Special Economic Zones).
Because programmes overlap and not all are tractor-specific, a defensible way to quantify the effect is to model a range rather than a single point estimate:
- Base case (moderate attribution): assume 35–50% of incremental new-tractor registrations versus a “no-incentive counterfactual” are enabled by incentives (through direct grants, tax credits, or financing improvements).
- Best case (high attribution): if incentive processing is fast and cashflow constraints are binding, attribution can rise to 50–65% of incremental demand.
- Worst case (low attribution): if farms would have bought anyway due to high repair downtime, attribution may fall to 20–30%.
Interpretation: even in the worst case, incentives still meaningfully affect timing (bringing purchases forward), which is critical for manufacturers and dealers managing production, inventory, and service capacity.
For policy background on CAP/RDP structure and investment measures, see the European Commission overview of the Common Agricultural Policy (CAP).
TL;DR: A realistic model suggests incentives may account for roughly 20–65% of the incremental demand uplift (depending on processing speed and farm liquidity), and they strongly influence purchase timing.
Second-hand tractors and fleet ageing in Italy: domestic resales vs imported used units
Italy’s second-hand market hit new highs in 2025, with used tractor transactions reported up about +6% year-on-year and long-term growth from ~25,000 to >60,000 annual purchases since 2014 (FederUnacoma-referenced figures). The key clarification is that “used” includes:
- Domestic used stock (resales within Italy): common in contractor circles and among smaller farms trading up/down.
- Imported second-hand units from other EU countries: often attractive on price, but policy-sensitive because they can slow domestic fleet renewal and complicate oversight on safety retrofits and emissions conformity.
FederUnacoma has cited an average fleet age of over ~22 years for tractors in circulation (context presented in sector briefings). Benchmark context: many Western European fleets are also ageing, but Italy’s combination of small farm structure and strong used-market liquidity can amplify the effect. In contrast, the US fleet often shows longer working lives too, but with different safety enforcement patterns and higher average horsepower utilisation; Germany and France tend to see faster adoption in high-tech segments due to larger farm sizes in key regions and stronger contractor penetration for self-propelled harvesting.
TL;DR: Italy’s used market is boosted by both domestic resales and EU second-hand imports; the result is a very old fleet that slows technology adoption and complicates safety/compliance upgrades.
Quantified benefits of fleet renewal: indicative fuel, productivity, emissions, and downtime impacts
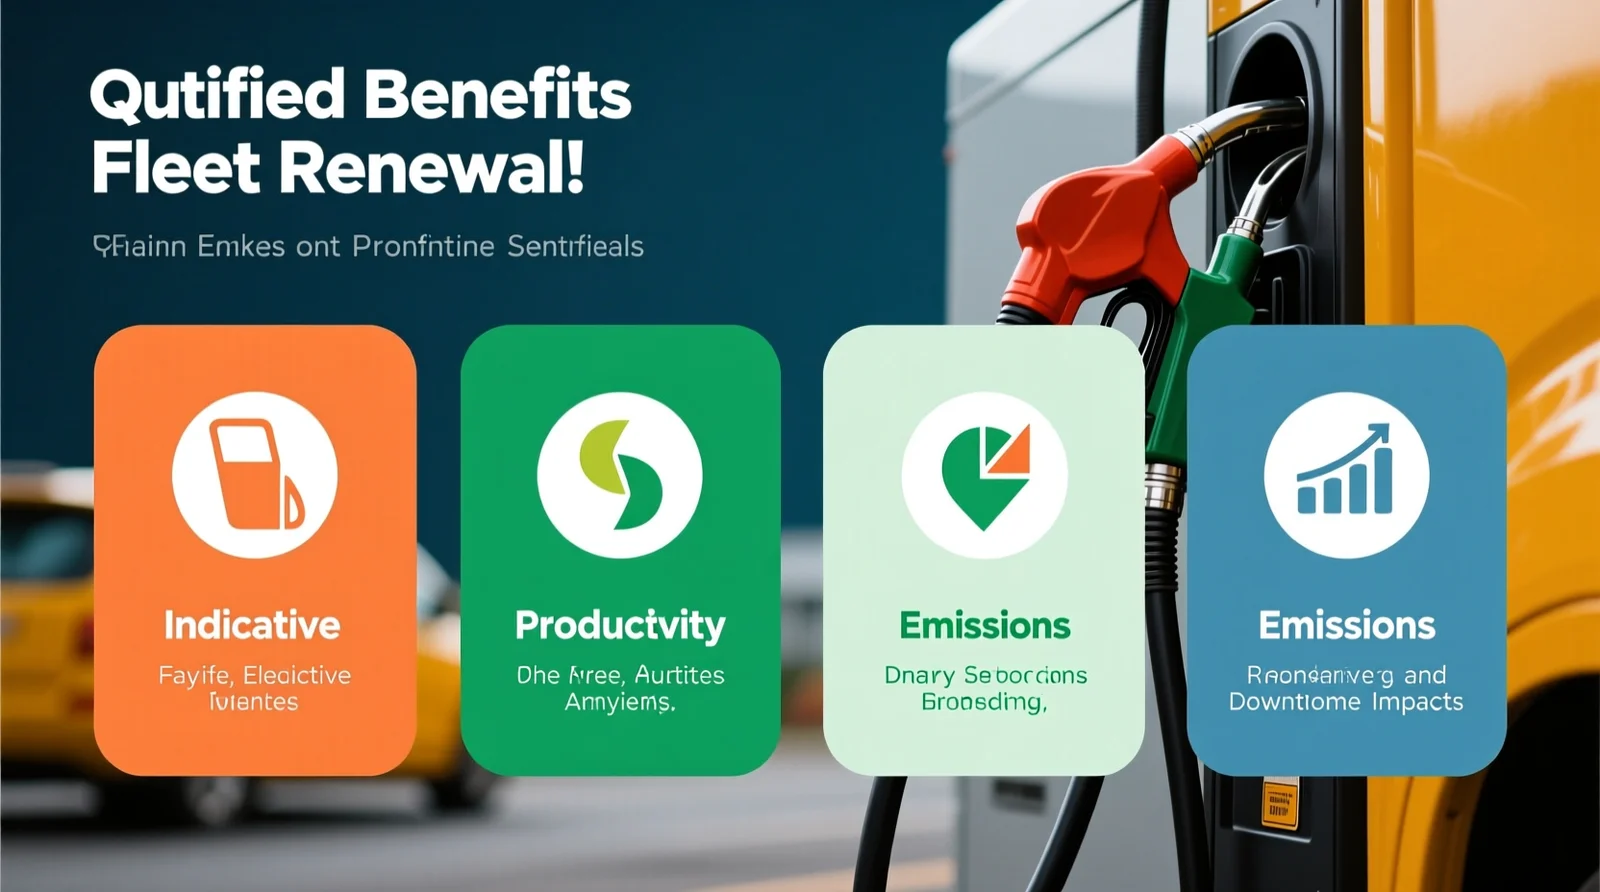
Replacing very old tractors and implements is not only a “modernisation” narrative—it can be an economically measurable decision. Indicative ranges (actual outcomes vary by workload, soil, operator skill, and implement match):
- Fuel efficiency: moving from older engines and drivetrains to modern powertrains and better implement matching can reduce fuel consumption by roughly 5–15% in comparable operations; in heavy draft work with improved transmission/traction management, the gain can be higher.
- Productivity and input savings via precision agriculture: guidance (GNSS—Global Navigation Satellite System) and section control can reduce overlap in seeding/fertiliser/spraying, often translating into 3–10% input savings in suitable crops and field geometries, with additional gains from improved timeliness.
- Downtime and maintenance: newer machines with telematics-based maintenance alerts can cut unplanned downtime; even a 1–3 fewer breakdown days per season can materially affect contractors and time-critical harvest operations.
- Emissions and regulatory readiness: newer EU tractor emission stages (Stage V for many categories) cut particulate matter and NOx significantly versus legacy engines, improving local air quality and easing compliance in regulated contexts. For regulatory framing, see the European Commission summary of vehicle emissions and air quality.
Economic interpretation: with incentives reducing effective purchase price, many farms target payback via combined effects of fuel + reduced repairs + higher work rate + input savings. In practice, payback periods frequently fall in the 3–7 year range for heavily utilised tractors/contractors, and longer for low-utilisation family farms unless incentives are strong.
TL;DR: Fleet renewal can deliver 5–15% fuel savings, 3–10% input savings in precision-ready operations, fewer breakdown days, and easier emissions compliance—often supporting 3–7 year payback where utilisation is high.
Regulatory and sustainability drivers shaping 2026–2030 machinery demand in Italy
The article’s earlier references to the European Green Deal and Farm to Fork become more actionable when linked to specific levers that affect machinery design and buying decisions:
- CAP conditionality and eco-schemes: many support payments are linked to baseline requirements (conditionality) and voluntary eco-schemes that encourage improved soil management, nutrient stewardship, and reduced chemical dependency—often requiring more precise application equipment and better data capture. (See the European Commission’s CAP 2023–27 overview.)
- Machinery safety and workplace compliance: safety-focused funding (e.g., ISI/INAIL) directly pulls demand toward machines with certified protections (roll-over protective structures, guarding, safer PTO systems, etc.).
- Emissions standards and urban/peri-urban constraints: tighter air-quality policies increase attention on Stage V compliance, efficient aftertreatment, and potentially alternative fuels in specific applications.
Interpretation: these frameworks don’t just “encourage sustainability”—they create compliance-linked ROI. Farms that fail to modernise may face higher operating risk (breakdowns, safety incidents), weaker eligibility for certain support instruments, and difficulty meeting buyer sustainability requirements.
TL;DR: CAP rules, eco-schemes, safety compliance, and emissions policies are direct demand drivers for precision-ready and safer equipment—not abstract sustainability messaging.
Italian agricultural machinery exports 2026: headwinds, scenarios, and what to watch
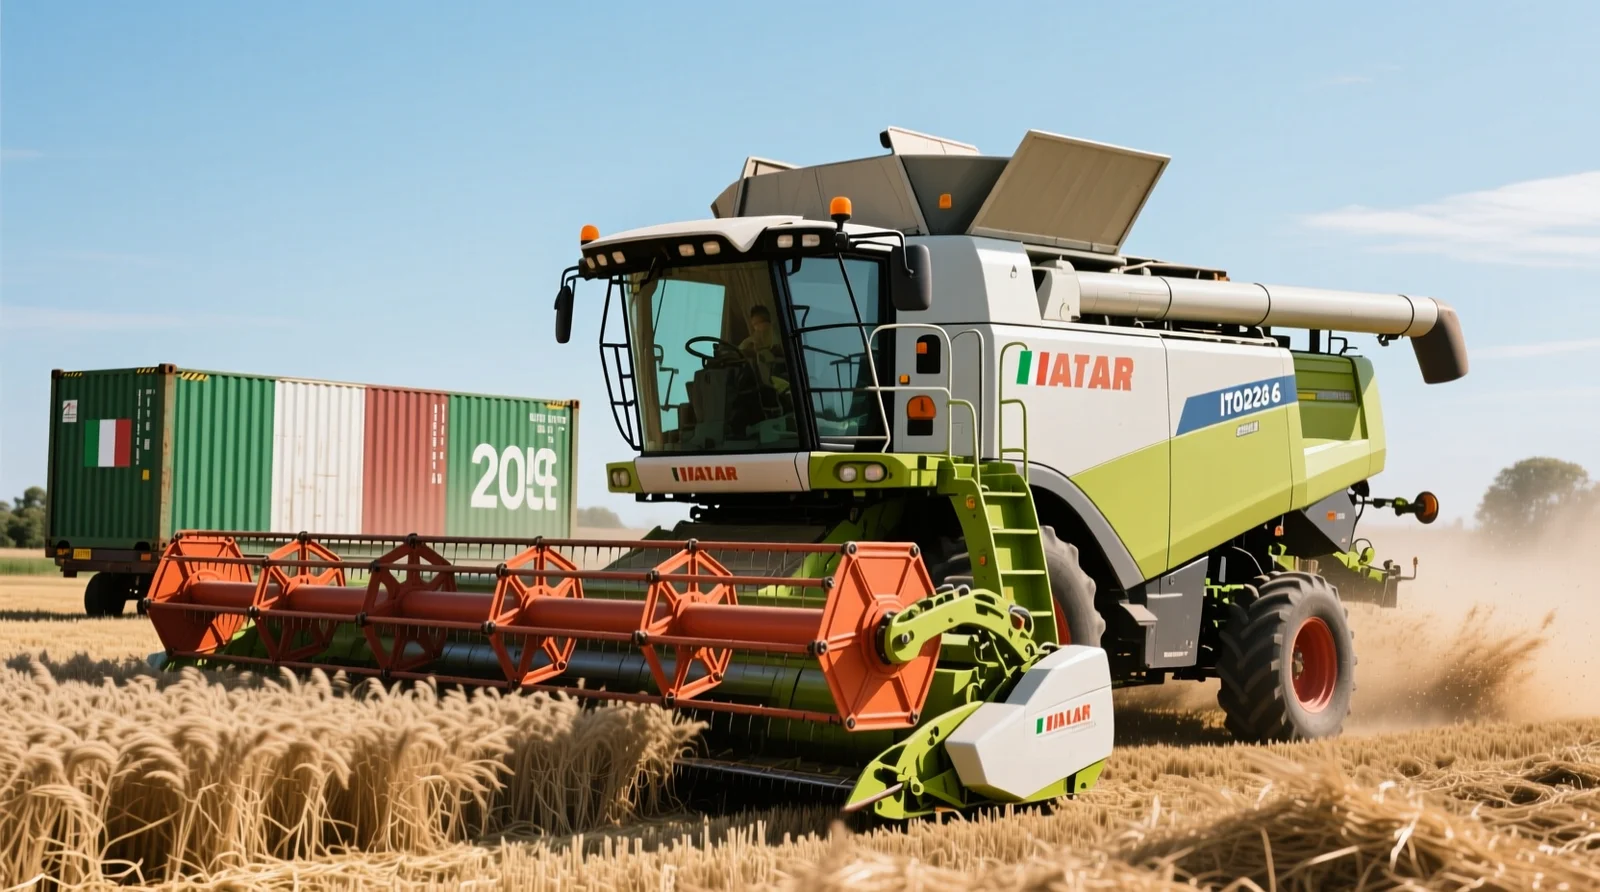
Exports remain the sector’s earnings engine, but 2026 starts with visible friction from tariffs, geopolitical tensions, and uneven farm-income cycles across regions. FederUnacoma has cited a global market softening (e.g., a -2.1% global contraction and a market value around €85.7 billion in the referenced year—figures that should be treated as sector estimates until final consolidated trade/industry accounts are published).
Time clarity on Italy’s export data: Istat foreign trade updates “to last October” showing a -4.8% export value change versus the same period in 2024 implies partial-year (provisional) comparison, not a final full-year balance. For readers who want to validate trade methodology and updates, see Istat’s official foreign trade statistics pages.
Scenario modelling for Italian agricultural machinery exports 2026 (directional, for planning):
- Best case: de-escalation of trade frictions and recovery in North American dealer restocking; exports return to +2% to +5% value growth vs 2025.
- Base case: EU demand stays soft but stable; US remains volatile; growth in Spain/Poland and selective non-EU wins partly compensate; exports range -1% to +2%.
- Worst case: renewed tariff/retaliation dynamics, weak commodity prices, and delayed financing; exports fall -5% to -10%, pressuring margins and dealer inventory.
Interpretation: because Italy’s export mix includes both high-spec equipment and specialised implements, the sector can outperform on niches even when the headline market is flat—provided distribution and service capacity are strong in the destination country.
TL;DR: Export data cited versus 2024 appears provisional; for 2026 planning, a realistic export range spans roughly -10% to +5% depending on trade/financing conditions.
Comparative benchmarks: Italy vs Germany, France, and the US
Putting Italy in context helps avoid reading domestic figures in isolation:
- Export dependence: Italy’s reported ~70% export share is broadly consistent with export-heavy European machinery clusters (Germany is also strongly export-oriented), while the US benefits from a much larger domestic market that can cushion export volatility.
- Fleet age dynamics: Italy’s tractor fleet age (~22+ years cited by FederUnacoma) reflects prolonged underinvestment by smaller farms. France and Germany also face ageing fleets, but higher average utilisation among contractors and larger farms can accelerate replacement in certain horsepower (HP) classes.
- Market positioning: Italy traditionally over-indexes in specialised tractors, implements, and vineyard/orchard solutions, while Germany and the US have strong positions in high-horsepower tractors and large-scale harvesting ecosystems. This shapes where Italian exporters can win: specialised agronomy, adaptability, and implement/tooling innovation.
Interpretation: Italy’s comparative advantage is less about competing on lowest price and more about fit-for-purpose engineering + modular implement ecosystems + service responsiveness.
TL;DR: Italy is structurally export-dependent like Germany, faces a particularly old fleet, and competes best via specialised, adaptable equipment rather than scale-driven price competition.
Competitive pressure from China and India: what changes in 2026 and how to defend margins
Chinese and Indian manufacturers continue gaining ground, especially in entry-to-mid segments. The article cites Chinese suppliers reaching 9% share of the European market and 12% in Italy in 2025 (these shares should be read alongside the specific source publication and whether they refer to units, value, or a defined category set; sector presentations often differ on scope).
Where Italy can defend and grow—even when unit-price competition intensifies:
- Total cost of ownership (TCO): not just purchase price—fuel, uptime, resale value, and implement compatibility.
- Service as a product: dense dealer coverage, faster parts availability, remote diagnostics (telematics alerts, error-code triage), and uptime guarantees for contractors.
- Compliance-by-design: easier documentation and conformity for EU safety/emissions requirements.
- Segment focus: defend premium/specialty segments (orchards/vineyards, hillside operations, niche implements) where agronomic constraints reduce commoditisation.
TL;DR: Low-cost entrants raise price pressure, but Italian brands can protect margins via TCO, compliance, specialised applications, and measurable uptime/service performance.
Export strategy playbook for India, Latin America, and Southeast Asia: localisation, financing, partnerships
“Entering new markets” only works when strategy matches how farmers buy, finance, and service machines locally. A deeper set of levers for India, Latin America, and Southeast Asia includes:
- Localisation of assembly and sourcing: CKD/SKD (completely/semi-knocked down) assembly partnerships can reduce duties, improve eligibility for public procurement, and shorten lead times—especially in India and parts of ASEAN.
- Tailored product ranges by HP class: in India and many Southeast Asian contexts, demand often skews toward lower-to-mid HP tractors plus robust, simple implements; in Brazil/Argentina, opportunities expand in higher HP, high-capacity implements, and precision sprayer ecosystems.
- Financing schemes: captive finance, partner banks, seasonal repayment, and bundled service/extended warranties to reduce farmer risk and smooth cashflow.
- Distributor/cooperative partnerships: working with local dealers, farmer cooperatives, and contractor networks to scale service and demonstrations quickly.
- Application-led selling: bundle machines with crop-specific packages (e.g., sugarcane, rice, horticulture), including training and calibrated implement settings.
Interpretation: the winning export model is increasingly “product + finance + service + training,” not just shipping equipment.
TL;DR: Growth markets require localisation, HP-tailored ranges, structured financing, strong distributor/co-op partnerships, and application-led bundles that include service and training.
EIMA 2026 Bologna trade fair for farm equipment: what it does in practice for sales pipelines
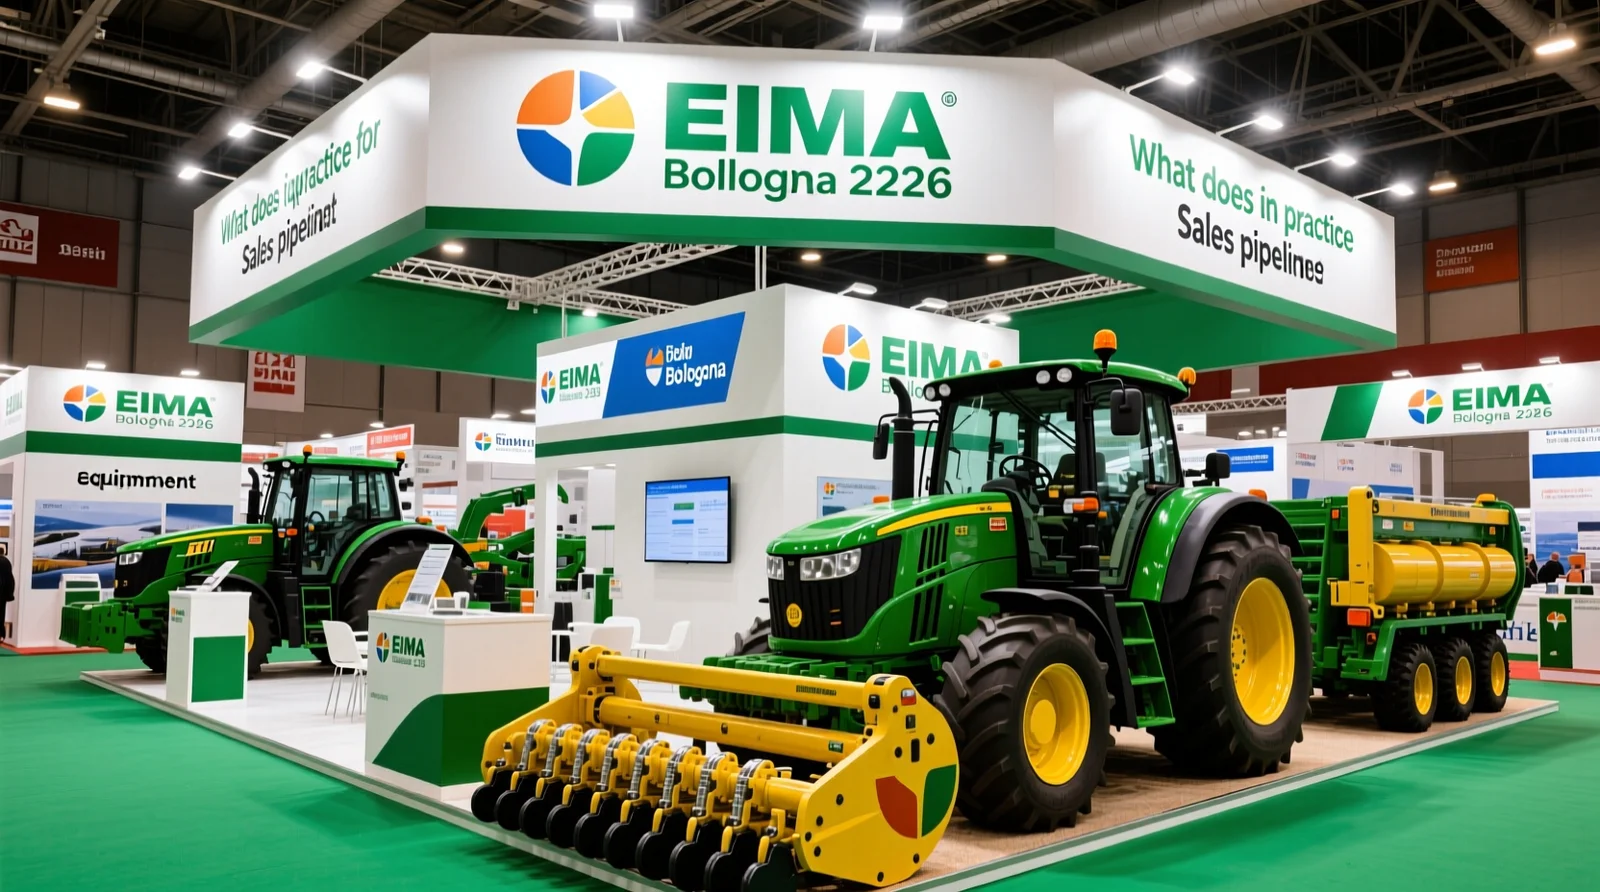
EIMA International 2026 (Bologna, 10–14 November 2026) is organised by FederUnacoma and functions as a working marketplace across tractors, self-propelled machines, implements, components, and digital systems. To reduce generic phrasing: EIMA’s practical value is that it concentrates dealer qualification, export lead generation, and technology benchmarking in a short cycle—especially useful when exporters must replace demand lost in one or two major destinations.
How each segment is typically showcased:
- Tractors: new platforms, specialty tractors, powertrain updates, guidance-ready packages.
- Self-propelled machines: harvesting and spraying innovations, capacity improvements, automation and operator-assist features.
- Implements: soil health tools, precision metering, residue management, and compatible “smart implements.”
- Digital solutions: telematics, implement control (ISOBUS—ISO 11783 communication standard for tractor-implement data exchange), farm management software, and decision support tools.
For official event information and updates, use the organiser’s site: EIMA International.
TL;DR: EIMA 2026 is a high-density venue for export leads and technology comparisons across tractors, self-propelled machines, implements, and digital systems—useful for rebuilding pipelines under export headwinds.
Risk management: what if incentives are reduced, delayed, or redesigned?
Over-dependence on incentives is a real business risk for both manufacturers and farms. If key measures (Industry 4.0 tax credit, RDP investment lines, ISI/INAIL funding windows) are reduced, delayed, or redesigned, likely effects include:
- Demand “cliffs” (sharp drops after deadline windows), increasing factory volatility and dealer inventory risk.
- Shift back to used purchases, including imported second-hand, delaying safety and emissions upgrades.
- Lower digital adoption because connected features often depend on incentive economics to clear payback hurdles.
Mitigation strategies: manufacturers can expand financing, develop lower-cost “digital-ready” trims, and build service subscriptions that reduce lifecycle cost; policymakers can reduce volatility by shifting from one-off windows to multi-year, predictable allocations.
TL;DR: If incentives weaken, Italy likely sees demand cliffs and a rebound in used imports; stability improves when policies are multi-year and companies offer finance + lifecycle cost reductions.
Actionable recommendations for manufacturers, policymakers, farmers, and dealers

- Manufacturers: package exports as equipment + parts availability + remote diagnostics + training; build “market entry kits” for India/ASEAN (mid-HP + robust implements + finance) and for Latin America (higher HP + large-scale implement ecosystems).
- Policymakers: prioritise multi-year incentive calendars and simplify processing; focus funding on measurable outcomes (safety incidents reduction, emissions, precision adoption) rather than short windows that cause demand spikes.
- Farmers/contractors: evaluate purchases with TCO and seasonal timeliness value; when incentives apply, target machines that unlock input savings (guidance, section control, variable-rate readiness) and reduce downtime risk.
- Dealers: invest in service differentiation—parts fill-rate, technician training, telematics monitoring—and build trade-in programmes that steer customers away from very old units with safety liabilities.
- Industry associations: publish clearer segmentation (units vs value, categories included) to improve market transparency and help SMEs plan production/export priorities.
TL;DR: Win the next cycle with multi-year policy stability, TCO-led buying, export bundles (finance + service), and dealer capability in uptime/diagnostics.
FAQ
Q: What are the main drivers of the Italian agricultural machinery market in 2026?
A: The strongest drivers are incentive-supported fleet renewal (e.g., ISI/INAIL safety funding, CAP/RDP investment measures, and Industry 4.0 tax credits for connected equipment) plus the need to replace high-maintenance tractors in an ageing fleet (often cited at ~22+ years on average). A practical estimate is that incentives may account for roughly 20–65% of incremental demand uplift depending on programme speed and farm liquidity, with a major impact on purchase timing.
Q: How does precision agriculture and digitalisation affect machinery purchases in Italy, and what are the adoption barriers?
A: Precision agriculture adoption increases demand for GNSS guidance, ISOBUS-enabled implements, telematics (remote machine monitoring), and data platforms for job documentation and input optimisation. Typical benefits can include ~3–10% reduction in input overlap in suitable operations and fewer downtime days via predictive maintenance. Barriers in Italy often include fragmented farm size, limited operator training time, connectivity gaps in rural areas, and interoperability concerns between mixed-brand fleets.
Q: Are used tractors in Italy mostly domestic resales or imported second-hand machines from other EU countries?
A: It is a mix of both. Domestic resales remain significant due to active contractor and small-farm trading. However, imported second-hand units from other EU countries also play a role because they can be cheaper and readily available. This distinction matters: higher reliance on imported used units can slow domestic fleet renewal and complicate enforcement of safety upgrades and emissions conformity.
Q: What safety and regulatory compliance advantages do new tractors have compared with 20+ year old machines?
A: Newer tractors are more likely to meet current safety expectations (better guarding, safer operator stations, improved roll-over protection, and more consistent maintenance documentation) and emissions requirements (e.g., Stage V in many categories). Older machines can still be used legally in many cases, but they often require retrofits and more rigorous operator discipline. Incentives such as ISI/INAIL specifically target risk reduction, making safety compliance a direct economic factor in replacement decisions.
Q: What is a typical payback period for renewing farm machinery in Italy under incentive schemes?
A: It depends mainly on annual utilisation and whether precision features are actively used. For contractors or high-hour farms, combined gains (5–15% fuel savings, fewer breakdown days, possible 3–10% input savings where applicable) can support payback in roughly 3–7 years, especially when grants or tax credits reduce the effective purchase cost. Low-utilisation farms may see longer payback unless incentives are strong or downtime risk is high.