
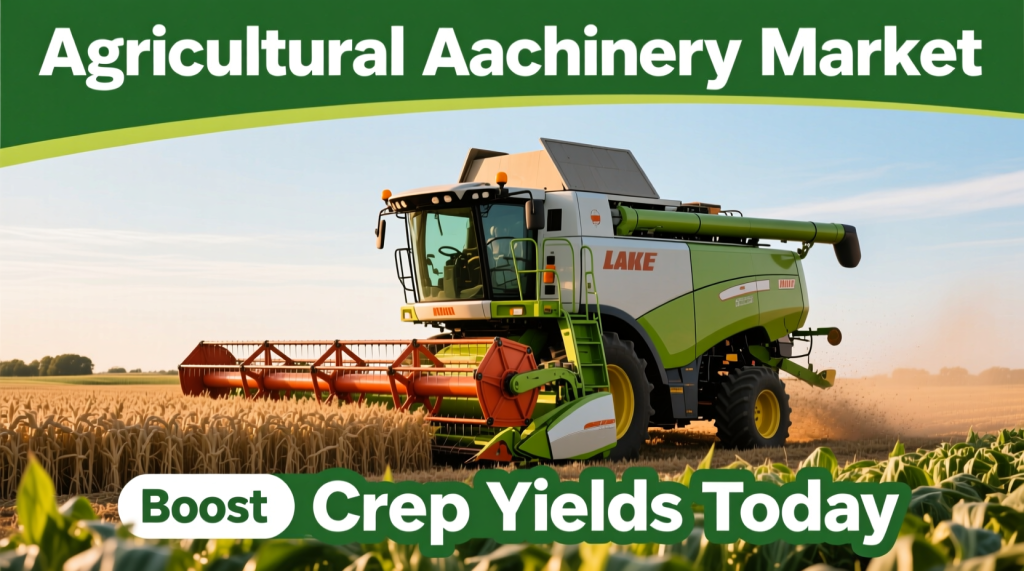
Meta overview: This analysis covers the global agricultural planting and fertilizing machinery market size (base year 2024), forecast (2025–2034), core segment splits (type, operation, power source, capacity, application, end use), and mechanization trends by region. It is written for OEMs (original equipment manufacturers), dealers, investors, and policymakers who need a practical view of demand drivers, adoption barriers, and where ROI (return on investment) is most defensible.
Market size & forecast: The market is projected to expand from USD 114.4 billion (2024) to about USD 174.3 billion by 2034, implying a 4.3% CAGR (compound annual growth rate) over 2025–2034 (all projections referenced to the 2024 base year).
What counts in this market: Agricultural planting and fertilizing machinery includes equipment used to place seed and nutrients accurately and efficiently—such as seed drills, planters, transplanters, fertilizer spreaders, and seed-cum-fertilizer drills. Increasingly, these implements are paired with GPS (Global Positioning System) guidance, auto-steer, and VRT (variable-rate technology) controllers to match application rates to field variability.
Comparative adoption insight: Planting upgrades typically happen first on larger farms because planter performance is tightly linked to narrow “planting windows,” and small errors scale into yield losses across many hectares. Fertilizing upgrades often follow a different curve: adoption can be faster where regulations and nutrient accounting are strict (e.g., parts of Europe) and where fertilizer prices or runoff penalties make savings immediately visible.
Methodology / data sources note: Market sizing and segment shares are synthesized from a mix of industry association statistics (e.g., tractor/implement registrations), OEM financial reports, and public policy/regulatory documentation. Forecasts for 2025–2034 assume broadly stable policy direction and technology cost-down trends, using constant-price logic where possible and triangulating near-term demand signals (registrations, shipments, and replacement cycles).
External references for credibility: For policy context influencing fertilizer and precision adoption, see the European Commission overview of the Nitrates Directive and the Common Agricultural Policy (CAP) overview. For broader market and sustainability framing, FAO’s work on sustainable productivity is a helpful reference point: FAO sustainability.
TL;DR: The article quantifies the 2024 base market, forecasts 2025–2034 growth, and explains which segments and regions are buying planting vs fertilizing tech—plus what blocks adoption and where ROI is most realistic.
Key Takeaways

- The global market was USD 114.4 billion (2024) and is projected to reach USD 174.3 billion by 2034 (4.3% CAGR, 2025–2034).
- By Type (revenue share): Planting Machinery leads at 58.2% (2025), reflecting the priority placed on stand establishment and planting-window risk management.
- By Operation (revenue share): Automatic machinery holds 83.5% (2025) as labor scarcity and consistency requirements push automation.
- By Power Source (revenue share): ICE (internal combustion engine) remains dominant at 67.1% (2025) due to fueling/service infrastructure and duty-cycle demands.
- By Capacity (revenue share): Mid-capacity machinery accounts for 56.4% (2025), often the “sweet spot” for scaling farms and dealer-friendly SKUs.
- By Application (revenue share): Seed planting leads at 34.7% (2025), supported by universal cross-crop demand.
- By End Use (revenue share): Large-scale commercial farms lead at 62.9% (2025), driven by measurable per-hectare savings and uptime requirements.
- Regionally: North America leads with 36.8% share, valued at USD 42.1 billion (2025).
TL;DR: Planting equipment is still the largest revenue pool, automation is the default buying direction, and mid-capacity ICE machines remain the volume backbone—while North America leads in value and APAC leads in momentum.
Type Analysis (including “precision planting equipment market” signals)
Planting Machinery (58.2% in 2025, revenue share): Planting equipment continues to take the larger share because it directly controls plant population, spacing, and emergence uniformity—variables that farmers can “see” quickly at the field edge and quantify at harvest. In the precision planting equipment market, features such as downforce control, row shutoffs, and singulation monitoring are increasingly treated as risk-reduction tools, not just yield-enhancement options.
Seed drills: Modern drills focus on consistent depth, residue handling, and fewer passes (reduced compaction and fuel). In many mixed-crop regions, drills remain the most cost-effective step into guided seeding because their productivity gains can be captured even before full farm digitization.
Planters & transplanters: Row-crop planters benefit most from GPS-based section control and row-level monitoring. Transplanters grow with horticulture and vegetable intensification where labor is expensive or scarce. Where soils vary sharply, row shutoff and rate control can reduce overlap and improve stand uniformity.
Fertilizing machinery: This segment is pushed by nutrient cost volatility and by compliance requirements. Precision fertilizer spreaders and injectors are often justified on measurable input savings (see the dedicated ROI notes in the “Market Drivers & ROI Benchmarks” section). Regulatory drivers are especially strong in Europe under water-quality rules such as the EU Nitrates Directive.
Seed-cum-fertilizer drills: In dryland and rain-fed systems, single-pass seed-and-fertilizer placement reduces passes and improves early nutrient access. These tools are particularly relevant where timing and moisture conservation matter more than absolute field speed.
TL;DR: Planting dominates because it controls the highest-impact “first decision” of the season; fertilizing gains fastest where fertilizer prices and regulation make savings easier to prove; seed-cum-fertilizer drills win where single-pass efficiency and moisture protection matter.
Operation Analysis

Automatic (83.5% in 2025, revenue share): “Automatic” here refers to equipment with automated metering/control and integrated guidance (often ISOBUS-compatible). ISOBUS is an ISO (International Organization for Standardization) communication standard (ISO 11783) that allows tractors and implements to share data and controls via a common interface.
Automatic systems are favored where:
- Farm managers need repeatable outcomes across multiple operators and shifts.
- Weather windows compress and machines must run longer hours with fewer errors.
- Variable-rate prescriptions (seeding and/or nutrients) are used at scale.
Manual: Manual and simpler semi-mechanized solutions remain relevant for fragmented fields, steep terrain, and low-horsepower contexts. Adoption is increasingly “stepwise”: guidance/monitoring first, then section control, then full variable-rate—especially when financing or service support is limited.
TL;DR: Automation leads because it standardizes results and reduces operator dependency; manual persists where fields are small/fragmented or capital and service access are constrained.
Power Source Analysis
ICE (67.1% in 2025, revenue share): Diesel-driven tractors and self-propelled units remain the default for high-duty cycles, long run-times, and heavy pulling requirements. Dealers also carry deeper ICE service capability, which matters during time-critical planting periods.
Electric: Electric implements/compact tractors are gaining traction in lighter-duty use cases such as controlled-environment agriculture. CEA (controlled-environment agriculture) includes greenhouses and indoor farms where predictable duty cycles and access to on-site power improve feasibility.
Hybrid: Hybrid powertrains are positioned as a transition option when farms want fuel savings but cannot risk charging downtime. Their best fit is often mid-to-large farms that track fuel per hectare and can monetize incremental efficiency.
TL;DR: ICE remains dominant for range and serviceability; electric grows in predictable/contained environments; hybrids target farms seeking emissions and fuel reductions without operational risk.
Capacity Analysis (clarifying what “capacity” means)

Definition: Capacity here refers to machine throughput—typically working width, hopper size, and field productivity per hour—not engine size alone.
Mid-capacity (56.4% in 2025, revenue share): Mid-capacity equipment is the most “financeable” category for scaling farms and often the most dealer-friendly because it fits a broad range of tractor horsepower classes. In many APAC markets, the most common winning configuration is mid-capacity automatic planters paired with ICE tractors, because it balances price, serviceability, and measurable labor savings.
Low-capacity: Low-capacity tools serve smallholders and specialty plots. They often represent the first mechanization step, particularly when bundled with subsidies or offered via rental/custom-hiring models.
High-capacity: High-capacity machines dominate very large acreages where completing operations inside narrow windows is worth the high capex. These units typically include the richest precision stack (telemetry, auto-calibration, advanced section control) because small percentage improvements translate into large absolute savings.
TL;DR: Mid-capacity wins on cost-to-productivity balance; low-capacity is the entry ramp; high-capacity is justified by time-window economics and scale-driven savings.
Application Analysis (what work is being done)
Seed planting (34.7% in 2025, revenue share): The biggest application because every cropping system plants. Innovation centers on placement accuracy at speed and on handling field variability with fewer passes.
Fertilizer application (fastest-growing): Demand is rising for variable-rate fertilizer spreaders (i.e., spreaders that automatically change application rate using maps/sensors). Growth is strongest where nutrient costs are high, regulation is strict, or both. Adoption also rises when farms can document nutrient stewardship for audits or sustainability-linked financing.
Soil preparation: Equipment is shifting toward reduced till and single-pass systems to cut fuel and protect soil structure. That changes implement demand toward lighter disturbance and better residue management.
Crop care: In-season nutrient correction increasingly ties to software and sensing. The value proposition is speed of decision (detect deficiency → apply precisely) rather than just mechanical throughput.
TL;DR: Planting remains the largest application, fertilizer application grows the fastest with VRT, and soil prep/crop care evolve with conservation practices and sensor-driven timing.
End Use Analysis (who buys vs who uses)

Large-scale commercial farms (62.9% in 2025, revenue share): These operations typically have the management bandwidth to use data tools and the cash flow to justify downtime-reduction features. They also measure input use per hectare tightly—making precision upgrades easier to approve internally.
Family-owned farms: Growth is increasingly tied to financing access, dealer capability, and service models (rental, custom hiring, “machinery-as-a-service”). Many family farms adopt in stages: guidance + monitoring first, then variable-rate once they trust data quality and have support.
TL;DR: Large farms buy first because savings and uptime scale; family farms adopt progressively when financing, training, and service models reduce risk.
Market Drivers & ROI Benchmarks (consolidated precision benefits)
1) Labor constraints and timing risk: In many regions, the limiting factor is not land—it’s the ability to complete planting and nutrient operations on time. Automation reduces dependency on highly skilled operators and improves consistency across shifts.
2) Input economics (what farmers can actually measure): The most defensible near-term business case comes from reducing waste and overlap. Typical outcomes reported in precision agriculture case literature include:
- Fertilizer savings: commonly 5–15% reduction with VRT and section control in variable fields (higher when variability is high and prior practice was uniform-rate).
- Seed savings: often 2–8% in row crops via section control/row shutoffs (depends heavily on field shape and headlands).
- Yield uplift: frequently 1–5% when improved placement reduces skips/doubles and nutrients are better matched to soil zones (results vary widely by crop and management).
3) ROI and payback periods (benchmarks, not guarantees): Payback depends on acreage, crop value, input prices, and the farm’s baseline practices. As a practical benchmark:
- Large farms: precision upgrades (guidance + section control + variable-rate) often target ~1–3 years payback when used across substantial hectares.
- Mid-sized farms: payback commonly stretches to ~2–5 years unless equipment is shared/rented or input prices spike.
External reference point: For high-level evidence and frameworks around precision agriculture and digital farming impacts, see FAO’s digital agriculture resources: FAO Digital Agriculture.
TL;DR: The strongest drivers are time-window execution and measurable input savings; typical savings ranges are mid-single to low-double digits, and payback is fastest on larger acreages or via shared-service models.
Market Restraints (adoption barriers that slow the curve)

High capital cost and “option value” hesitation: Precision-enabled machines bundle hardware, sensors, and software—raising upfront price and increasing perceived risk. In uncertain commodity cycles, many farms delay upgrades unless dealers can structure financing around cash-flow seasons or demonstrate a clear “before vs after” savings case.
Skills and service bottlenecks: Precision systems require:
- GPS/RTK calibration (RTK = real-time kinematic correction for higher positioning accuracy)
- Prescription map creation and data hygiene
- Sensor troubleshooting and firmware/software updates
If dealer networks lack trained technicians or spare parts, downtime risk becomes the deciding “no,” especially during planting windows.
Connectivity and data interoperability: Rural connectivity gaps and mixed-brand fleets can limit the practical use of telematics and data platforms. Even with ISOBUS, feature compatibility and data format issues can reduce the value captured from the equipment.
TL;DR: Adoption slows when capex is high, dealer/service capacity is thin, or data/connectivity issues prevent farms from realizing the promised savings.
Emerging Trends (non-duplicative, forward-looking)
Autonomy and assisted autonomy: Semi-autonomous spreading and planting functions are moving from pilots to operational use on large farms where labor is scarce and fields are suited to automation. GPS-RTK guidance, obstacle detection, and implement guidance reduce overlap and operator fatigue.
“Hardware + service” bundling: More OEMs and dealers are packaging equipment with setup, calibration, agronomic support, and seasonal optimization. This shifts differentiation from just machine specs to delivered outcome (uptime, accuracy, verified savings).
Single-pass systems and conservation alignment: In moisture-limited regions, single-pass seed-cum-fertilizer tools align with reduced disturbance and fewer field passes. This trend is driven as much by fuel/time economics as by sustainability reporting.
TL;DR: The next wave is autonomy, outcome-based service bundles, and single-pass systems tuned for conservation and time/fuel efficiency.
Regional Analysis (with “mechanization trends by region” structure)
This section highlights mechanization trends by region through three lenses: regulatory context, mechanization level, and credit/financing environment—because those variables explain why planting vs fertilizing adoption differs.
Regional comparison snapshot (actionable)
| Region | Mechanization level | Precision adoption focus | Regulatory intensity (nutrients) | Financing environment |
|---|---|---|---|---|
| North America | High | Planting automation + VRT scaling | Medium (varies by state/province) | Strong dealer + mature credit |
| Europe | High | Fertilizer precision + documentation | High (water quality and eco-schemes) | Moderate; replacement sensitive to prices |
| Asia Pacific | Mixed (low→mid, rising) | Mid-capacity planters/drills; service models | Rising (country-dependent) | Policy-supported, custom-hiring growth |
| Latin America | Mid→High in export corridors | High-capacity planting + nutrient efficiency | Medium | Cyclical; commodity/FX-driven |
| Middle East & Africa | Low→Mid (uneven) | Durable mid-capacity; targeted projects | Mixed | Project-based; donor/public programs |
Regulatory context: Nutrient rules exist but vary by jurisdiction; the stronger adoption driver is scale economics and operational efficiency.
Mechanization level: Very high. Large acreages create immediate value from reduced overlap, higher field speed, and uptime.
Credit and financing environment: Mature dealer financing and robust used-equipment channels support faster technology refresh cycles.
Comparative adoption: Planting automation often leads adoption decisions; fertilizing VRT accelerates when fertilizer prices rise or where runoff scrutiny increases.
TL;DR: North America buys precision because it scales—big fields make small percentage savings pay quickly.
Asia Pacific (fastest-growing)
Regulatory context: Policy focus is frequently on mechanization access and productivity; environmental compliance is rising but uneven.
Mechanization level: Mixed—ranging from smallholders to rapidly consolidating mid-sized farms.
Credit and financing environment: Subsidies, low-interest programs, and custom hiring centers often matter more than headline equipment specs.
Comparative adoption: Adoption frequently starts with planting/drilling mechanization to reduce labor and ensure timeliness. Fertilizing precision follows when advisory services, soil testing, and dealer support mature.
TL;DR: APAC growth is access-driven—mid-capacity, service-supported planting equipment scales first; fertilizer precision follows the ecosystem (soil testing, advice, service).
Europe
Regulatory context: High. Water-quality and eco-scheme compliance pushes demand for traceable, accurate nutrient application (see Nitrates Directive and CAP overview).
Mechanization level: High, but replacement cycles can slow when margins compress.
Credit and financing environment: Stable but sensitive to equipment pricing and farm income variability.
Comparative adoption: Fertilizing precision and documentation can outpace planting upgrades in some markets because compliance creates a near-term “must-have” requirement.
TL;DR: Europe’s precision demand is regulation-shaped—nutrient accuracy and reporting drive fertilizing machinery upgrades.
Latin America
Regulatory context: Moderate; stewardship is growing, but the main driver is export-crop competitiveness.
Mechanization level: High in major export corridors (e.g., Brazil/Argentina row-crop regions).
Credit and financing environment: Cyclical and tied to commodity prices and FX—purchase timing matters as much as technology.
Comparative adoption: High-capacity planting is often prioritized to cover vast hectares quickly; fertilizing VRT follows when it can be operationalized without adding complexity during peak seasons.
TL;DR: Latin America buys for throughput first—then layers precision where it doesn’t disrupt peak-season execution.
Middle East & Africa
Regulatory context: Mixed; food security and water constraints shape investment priorities more than uniform regulation.
Mechanization level: Uneven—project-led in some areas and low baseline in others.
Credit and financing environment: Often program- or project-based, including public funding and development initiatives.
Comparative adoption: Planting and fertilizing investments concentrate in commercial projects (irrigated, desert farming, commercial grain corridors) where uptime and durability matter most.
TL;DR: MEA adoption is uneven—growth clusters around funded projects and durable equipment needs in water-limited systems.
Key Players Analysis
The market is moderately consolidated, with leading OEMs competing on agronomic accuracy, automation, uptime, and dealer-enabled service delivery.
AGCO Corporation: Focuses on integrated precision seeding and connected services across multiple brands, targeting large commercial farms and scaling mid-sized operations.
CLAAS: Reported net sales of €4,997.4 million (FY ending 30 Sep 2024) and R&D spend of €330.8 million, signaling ongoing investment capacity for advanced seeding and nutrient placement solutions.
CNH Industrial: Reported FY2024 consolidated revenues of USD 19.84 billion and net income of USD 1,259 million. In planter automation, the company has cited guidance improvements that place a high share of seeds within a narrow lateral tolerance band (0–5 cm), supporting stand uniformity outcomes when correctly calibrated and operated.
Kubota: Strong positioning in small-to-mid farm mechanization and precision-enabled upgrades, particularly where compact/mid-capacity equipment is the practical purchase class.
Other notable players: Deutz-Fahr Group, Kinze Manufacturing, Kverneland, Lemken, Mahindra & Mahindra, Maschio Gaspardo.
TL;DR: Competitive advantage is shifting from iron alone to “iron + precision + dealer support,” with OEM financial strength and service networks shaping adoption speed.
Recent Developments

- 2025: CNH expanded planter automation features (including implement guidance) aimed at tighter path tracking to reduce row-to-row variability and improve placement consistency.
- 2025: Deutz-Fahr Group partnered with Topcon Agriculture and PFG America to expand aftermarket precision-ag capability and support coverage for compatible equipment fleets.
TL;DR: Partnerships and guidance automation upgrades show the market’s direction: improve accuracy, make retrofits easier, and scale support through dealer/service ecosystems.
Outlook and Strategic Implications (for OEMs, dealers, investors, policymakers)
OEMs: Prioritize product lines that convert clearly into ROI—especially mid-capacity automatic planters (high-volume) and variable-rate fertilizer spreaders (fast-growing). Invest in dealer training, diagnostics, and parts logistics as aggressively as new features.
Dealers: Treat precision setup and in-season support as a core margin line. Bundled calibration, prescription support, and “planting-window service plans” can reduce buyer hesitation more effectively than discounting.
Investors: Watch for platforms that monetize recurring revenue (software, subscriptions, service) and for businesses positioned around retrofits and mixed-fleet interoperability—where adoption barriers are lower than full machine replacement.
Policymakers: If subsidies aim to raise productivity and reduce runoff, design programs around measurable outcomes (e.g., verified nutrient savings, training completion, uptime support), not only capex rebates. Skill development and service infrastructure often unlock more adoption than one-time purchase incentives.
TL;DR: Winners will be those who reduce adoption risk—through service, training, financing, and outcome verification—while focusing on the segments with the clearest payback.
Conclusion

From a 2024 base of USD 114.4 billion, the agricultural planting and fertilizing machinery market is forecast to reach about USD 174.3 billion by 2034. The most durable demand comes from farms and regions where timing, labor availability, and input economics make precision upgrades defensible—especially planting automation in large-acreage systems and fertilizer precision in regulation- or cost-sensitive environments.
Adoption is not constrained by technology availability as much as by capex affordability, service readiness, data workflow maturity, and training. Providers that pair equipment with practical support models—financing, calibration, interoperability, and seasonal uptime—are most likely to convert interest into repeatable, scalable deployment.
TL;DR: Growth is real but uneven: the market expands where precision can be serviced, financed, and proven in-field with clear payback.
FAQ
Q: What’s the difference between the precision planting equipment market and standard planting machinery?
A: Precision planting equipment typically adds GPS guidance, section/row control, downforce management, and real-time monitoring to improve seed placement and reduce overlaps/skips. Standard planting machinery focuses more on basic mechanical placement and throughput. Precision features are most valuable where field variability, tight planting windows, and high input costs make small errors expensive.
Q: What payback period should farms expect for variable-rate fertilizer spreaders or precision planting upgrades?
A: Payback commonly lands around ~1–3 years for large farms that run many hectares through the system and can capture 5–15% fertilizer savings plus reduced overlap. Mid-sized farms often see ~2–5 years unless they share equipment, rent it, or face high fertilizer prices. Actual ROI depends on acres covered, crop value, baseline overlap, and the quality of soil maps/calibration.
Q: How can small farms start with precision agriculture at low cost?
A: Many start with guidance and basic monitoring (entry-level GPS lightbar or assisted steering), then add section control or retrofit rate controllers later. Another low-capex route is using custom hiring/rental services for peak-season planting or fertilizing, so the farm pays per hectare rather than buying the full machine. Cooperative ownership models can also spread costs across multiple users.
Q: Which regions are adopting fertilizer-precision systems faster, and why?
A: Parts of Europe often adopt fertilizer precision quickly because nutrient rules and documentation requirements are stricter (e.g., Nitrates Directive and CAP eco-schemes). North America adopts strongly where scale economics and input savings are easy to measure. APAC adoption accelerates as soil testing/advisory services and dealer support mature alongside mechanization programs.
Q: What are the most common barriers that delay adoption of advanced planting and fertilizing machinery?
A: The top barriers are high upfront cost, limited access to affordable financing, skills gaps (calibration, mapping, data management), and service/parts limitations that increase downtime risk. Connectivity and mixed-brand interoperability can also reduce the value farms get from advanced features if data workflows are not reliable.