Introduction

The global packaging machinery market is estimated at USD 61.88 billion in 2025 and is projected to reach USD 93.73 billion by 2032, implying a 6.1% compound annual growth rate (CAGR) for 2025–2032. These headline figures align with Coherent Market Insights’ (CMI) 2024 analysis of the packaging machinery market (forecasts are commonly presented in nominal terms unless otherwise specified; confirm the base-year currency and inflation treatment in the underlying report).
Growth is being pulled by (1) automation to offset labor constraints and improve throughput, (2) faster SKU churn that demands shorter changeovers, (3) e-commerce shipping robustness, and (4) tighter safety/traceability rules in food and pharma. In 2023–2024, investment also accelerated in robotics-enabled end-of-line systems (robotic case packers and cobot palletizers) and AI-driven quality inspection, especially where labor availability and compliance risk are high.
TL;DR: The market is forecast to grow from $61.88B (2025) to $93.73B (2032) on automation, flexibility, compliance, and e-commerce—based on CMI’s 2024 market view (typically nominal forecasts).
Market Overview and Scope (Primary vs. Secondary vs. Tertiary Packaging)
Packaging machinery includes equipment that forms, fills, seals, labels, codes, inspects, cartons/cases, and palletizes products for distribution and sale. For clarity, packaging is usually discussed in three layers:
- Primary packaging: the material in direct contact with the product (e.g., pouches, bottles, blister packs). Typical machines: automatic form-fill-seal (FFS) systems, fillers, cappers, blister packaging machinery, flow wrappers.
- Secondary packaging: groups primary packs for retail or handling (e.g., cartons, multipacks, bundles). Typical machines: cartoners, case packers, shrink bundlers, tray packers.
- Tertiary packaging: prepares goods for logistics (cases on pallets, stretch wrap). Typical machines: palletizers, stretch wrappers, pallet labeling and identification.
Across 2023–2024, buyers increasingly specify machines that can run recyclable mono-material films, handle lightweighting, and provide data for compliance audits. In Europe, the policy direction has tightened around packaging waste reduction and recyclability requirements—see the European Commission’s packaging and packaging waste workstream for context (European Commission: Packaging waste).
TL;DR: Market scope spans primary/secondary/tertiary packaging equipment; 2023–2024 demand skewed toward flexible, recyclable-material-ready machines and compliance-ready lines.
2023–2024 Market Snapshot: Segment Mix and Quantitative Context

While exact shares vary by source and methodology, most industry breakdowns show packaging machinery demand concentrated in high-throughput categories (FFS/filling/labeling) and end-of-line automation (case packing/palletizing) as labor constraints persist. Indicative comparisons used by industrial buyers and integrators include:
- Region growth tendency (indicative): Asia Pacific generally outpaces mature markets, frequently cited in the ~6–8% CAGR range for packaging equipment demand in growth cycles, vs. ~3–5% in North America/Western Europe where replacement/upgrade cycles dominate.
- Automation intensity: end-of-line robotics (robotic case packers, palletizing cells) often grows faster than legacy mechanical solutions because the ROI is more directly linked to labor reduction and warehouse throughput.
- Application mix: food & beverage remains the largest buyer group in most datasets, with pharma typically smaller in unit volume but higher in compliance-driven spend per line (serialization/vision/validation).
For readers validating compliance-driven demand in the U.S., the FDA’s FSMA (Food Safety Modernization Act) framework continues to raise expectations for preventive controls and documented processes, influencing coding, inspection, and traceability investments (FDA: FSMA overview).
TL;DR: Asia Pacific tends to grow faster than mature regions; robotics and inspection often outgrow legacy equipment; FSMA and EU packaging waste policies reinforce traceability and sustainability upgrades.
Key Market Players and 2023–2024 Notable Moves (Examples)
The market is moderately consolidated, with global OEMs (original equipment manufacturers) offering full lines and specialists focusing on niche packaging formats or end-of-line automation. Key players include Langley Holding, Rovema, Douglas, KHS, SIG, Tetra Laval, Krones, ProMach, GEA, Sacmi, Coesia, and Duravant.
Recent examples that illustrate where OEMs have been investing (technology depth and portfolio breadth):
- Robotics and end-of-line systems: OEMs and integrators continue launching compact cobot (collaborative robot)-assisted palletizing and robotic case packing cells aimed at faster deployment in brownfield plants where footprint and safety integration are limiting factors.
- Digital services: many large OEMs expanded remote diagnostics, condition monitoring, and spare-parts responsiveness to reduce downtime and improve OEE (Overall Equipment Effectiveness).
- Line integration: buyers increasingly favor suppliers that can own the integration layer across primary + secondary + tertiary packaging, including recipe management and electronic batch records for regulated industries.
To evaluate vendors beyond marketing claims, industrial teams commonly request measurable proof: installed base references in the same product category (e.g., “automatic form-fill-seal machines for snacks”), documented changeover time, guaranteed OEE bands, and service response SLAs (service-level agreements).
TL;DR: Competitive differentiation is shifting toward robotics-ready end-of-line automation, digital service uptime tools, and end-to-end integration capability with measurable OEE/changeover performance.
Packaging Machinery Segmentation by Machine Type (Mapped to Packaging Layer)
Below is a practical mapping of machine types to where they sit in the packaging process—useful when scoping projects or writing URS (User Requirement Specifications):
- Filling machines (Primary): liquid, powder, or granulate filling with hygienic design and dosing accuracy; critical in beverages/dairy, chemicals, and pharmaceuticals.
- Automatic form-fill-seal (FFS) machines (Primary): vertical or horizontal systems that form packages from rollstock, fill, then seal—common for automatic form-fill-seal machines for snacks, coffee, frozen foods, and pet food.
- Blister packaging machinery (Primary, Pharma): forms blisters, fills, lidding, and inspection—central to the pharmaceutical blister packaging machinery market where validation and data integrity are decisive.
- Labeling & coding (Primary/Secondary): applies labels plus traceability codes (2D codes, barcodes; RFID = radio-frequency identification), increasingly paired with vision verification.
- Cartoning & case packing (Secondary): cartons, trays, or cases; growing shift toward robotic case packers for mixed-SKU handling and short-run efficiency.
- Wrapping & bundling (Secondary/Tertiary): shrink, stretch, and flow wrap; e-commerce drives demand for right-sized protection and damage reduction.
- Palletizing (Tertiary): conventional layer palletizers and robotic palletizers; cobot palletizers target rapid deployment and flexible patterns for SMEs and co-packers.
- Inspection systems (Cross-cutting): checkweighers, metal detection, X-ray, and vision—newer systems increasingly use AI-assisted defect classification for faster false-reject tuning.
TL;DR: Map machines to primary/secondary/tertiary packaging early; growth is strongest where flexibility and inspection/traceability reduce risk and labor dependency.
Segmentation by Application: What’s Driving Capex in 2023–2024
- Food & beverage: the biggest engine for high-speed filling, FFS, and inspection. Investments focus on allergen control, seal integrity, and rapid changeovers for variety packs and seasonal SKUs.
- Pharmaceuticals: purchases skew toward validated systems, electronic records, and data integrity controls. Where software touches quality records, buyers may require features aligned with 21 CFR Part 11 (U.S. regulation for electronic records/e-signatures). Reference: eCFR: 21 CFR Part 11.
- Personal care: emphasis on aesthetics, frequent SKU changeovers, and gentle handling; labeling and serialization-like track-and-trace are rising for brand protection.
- Chemicals: safety-rated controls, corrosion-resistant materials, containment, and reliable sealing/capping to prevent leakage in transport.
TL;DR: Food & beverage drives speed and flexibility; pharma drives validation and Part 11-ready controls; chemicals prioritize safety/containment; personal care prioritizes presentation and fast changeovers.
Advanced Technologies Reshaping Packaging Lines (Servo, Vision, Digital Twins, Standardized Formats)
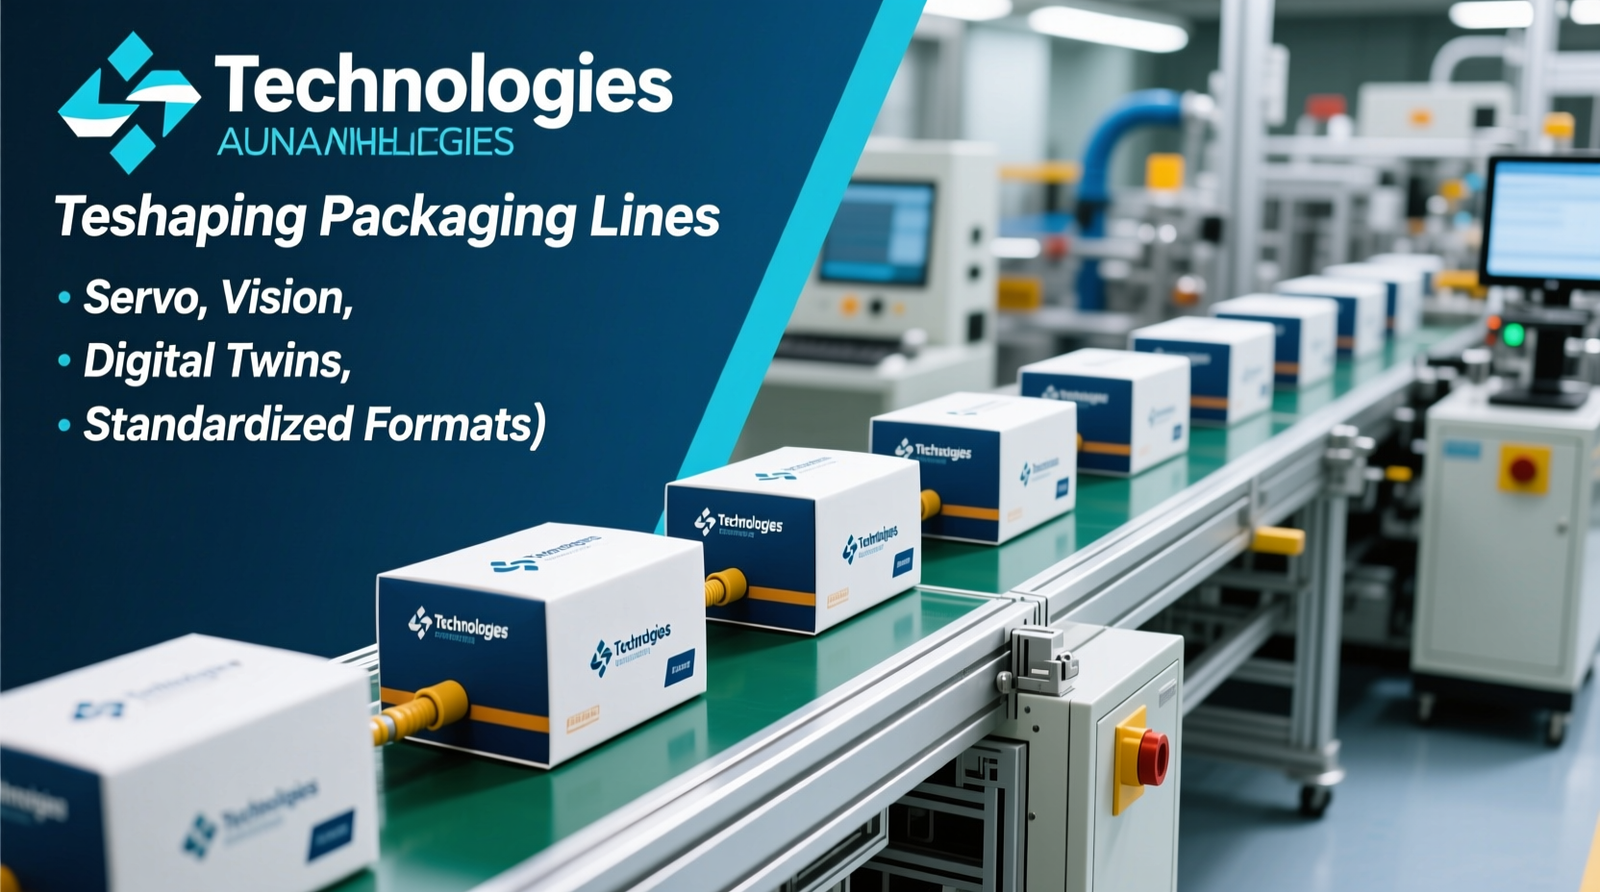
Modern packaging lines increasingly adopt:
- Servo-driven motion control: servo motors enable precise, programmable motion profiles versus fixed cams, improving flexibility and reducing mechanical change parts. Benefits include faster changeovers and smoother handling at higher speeds.
- Vision systems: camera-based inspection for label presence, code readability, seal checks, and packaging defects. AI-enabled vision can improve classification robustness but must be validated to avoid drifting performance.
- Digital twins: a virtual model of a machine/line used to test recipes, throughput, and failure modes before commissioning. In practice, this reduces ramp-up time and supports operator training.
- Format-part standardization: minimizing unique change parts across SKUs (or adopting tool-less adjustments) reduces changeover time and operator error—directly lifting OEE.
- Connected machines and cybersecurity: IIoT (Industrial Internet of Things) connectivity supports remote diagnostics and energy monitoring, but increases cyber risk, especially when connected to MES/ERP.
For readers wanting a neutral grounding on OEE and loss categories, see the reference overview from NIST’s manufacturing resources (NIST) and widely used industry frameworks (availability, performance, quality) applied in packaging line optimization.
TL;DR: Servo motion + vision + digital twins + standardized format parts drive flexibility and higher OEE; IIoT connectivity adds value but requires cybersecurity planning.
Safety, Compliance, and Hygienic Design: Why Standards Shape Machine Design
Safety and compliance are no longer “check-the-box” line items; they materially influence machine architecture, guarding, and control systems:
- ISO 13849: safety-related parts of control systems—often drives safety PLC architecture, redundant sensors, and validated safety functions. Source: ISO: ISO 13849-1.
- ISO 14119: interlocking devices with guards—affects guard switches, coded actuators, and defeat-prevention measures. Source: ISO: ISO 14119.
- CE/UL: CE marking (Europe) and UL (common in North America) influence electrical panel design, component selection, documentation, and inspection readiness.
- Hygienic design: food and dairy buyers may reference EHEDG (European Hygienic Engineering & Design Group) guidance for cleanability and contamination risk reduction (EHEDG). In U.S. dairy/food contexts, 3-A Sanitary Standards are also common (3-A SSI).
These requirements affect everything from material finishes and weld quality to door interlocks, lockout/tagout provisions, and documentation packages—often a major cost and timeline driver in pharma and high-care food.
TL;DR: ISO safety and hygienic design standards directly drive machine architecture, validation/documentation, and total installed cost—especially in food, dairy, and pharma.
Practical Buyer Guidance: How to Select Packaging Machinery (What Professionals Actually Compare)
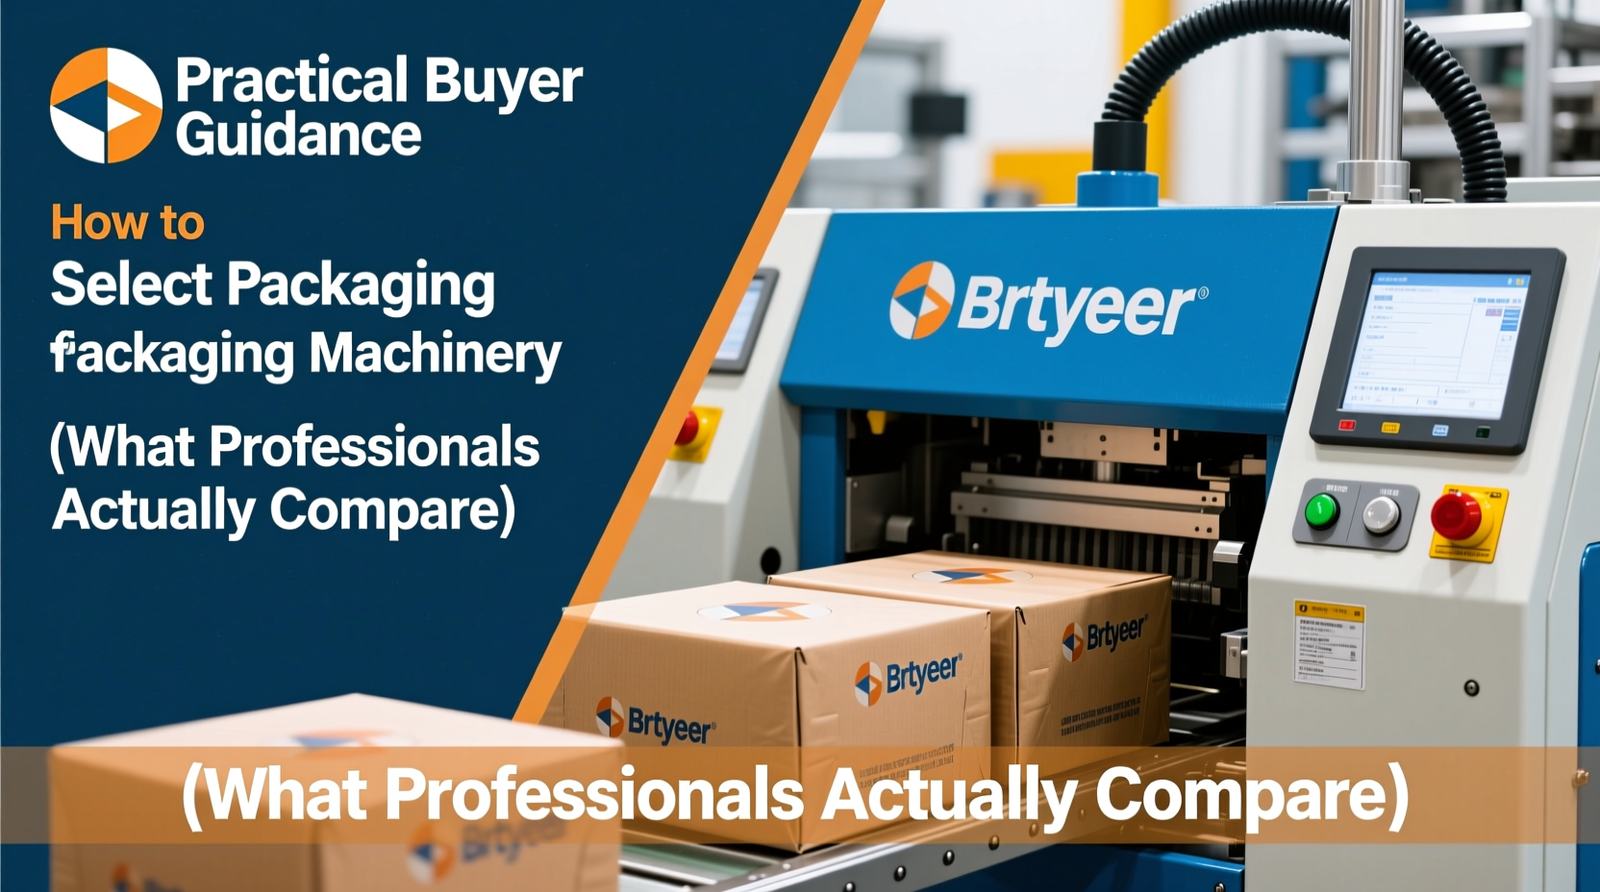
For OEM selection and line upgrades, industrial teams typically evaluate far beyond nameplate speed:
- TCO (Total Cost of Ownership): capex + spares + consumables + energy + planned maintenance + downtime risk over 5–10 years.
- OEE impact: ask for demonstrated OEE ranges on comparable products and packaging materials, not just best-case demonstrations.
- Changeover time: quantify current vs. target (e.g., 45–90 minutes down to 10–30 minutes) and what tooling/recipe management is included.
- Service network and parts availability: local response time, critical spares strategy, remote support, and obsolescence management for controls.
- Compliance fit: CE/UL needs, hygienic design requirements, and for pharma/regulated environments, audit-ready documentation and electronic records controls aligned to 21 CFR Part 11 where applicable.
- Integration readiness: data tags, standard protocols, and the ability to integrate with MES (Manufacturing Execution System) and ERP (Enterprise Resource Planning) for genealogy, downtime codes, and quality records.
TL;DR: Select equipment on TCO, proven OEE, changeover performance, service/parts coverage, compliance documentation, and MES/ERP integration—not just speed.
Automation Upgrades: Brownfield vs. Greenfield, Integration, and Typical Payback Levers
Packaging automation projects differ sharply depending on whether you’re retrofitting an existing plant (brownfield) or building a new facility (greenfield):
- Brownfield: prioritize footprint, guarding constraints, utility limits, and interoperability with legacy PLCs/HMIs. Cobot-based palletizers and modular robotic case packers can be attractive where re-layout is limited.
- Greenfield: design around straight-through flow, standardized controls, and data architecture from day one; this reduces integration cost and improves ramp-up stability.
Indicative ROI ranges depend on labor costs, uptime, and product mix, but many end-of-line automation investments target ~12–36 months payback, driven by:
- Labor reduction/redeployment (fewer manual pack/palletize roles per shift)
- Line speed increases (reduced micro-stoppages, stable feeding, better accumulation logic)
- Scrap and rework reduction (seal integrity, label verification, fewer damaged cases)
- Downtime reduction via predictive maintenance, better fault diagnostics, and standardized spares
TL;DR: Brownfield projects win with modular, integration-friendly automation; greenfield wins with standardized controls and data. End-of-line automation commonly targets ~12–36 month payback via labor, uptime, speed, and scrap gains.
Regional Outlook (with Practical Differences by Investment Theme)
- North America: replacement and modernization dominate; strong pull for traceability, inspection, and labor-saving robotics. FSMA-aligned process controls influence coding and verification investments.
- Western Europe: sustainability and packaging waste directionality heavily shapes material choices and sealing technology; buyers push for energy monitoring and recyclable-material capabilities (see EU packaging waste policy reference above).
- Asia Pacific: fastest expansion in new capacity (especially food, beverage, and personal care). Projects skew toward high-throughput lines and scalable automation as plants expand.
- Latin America: modernization of installed base is a frequent theme; robust, maintainable equipment with strong local service often beats peak-speed solutions.
- Middle East & Africa: selective growth around food processing hubs, import substitution, and logistics infrastructure; serviceability and operator training are key purchase drivers.
TL;DR: North America/Europe emphasize upgrades, compliance, and sustainability; Asia Pacific emphasizes capacity expansion; LATAM and MEA prioritize modernization and serviceability.
Concise Segment Summary (Table-Style, for Fast Scanning)
By machine type: Filling | Automatic FFS | Labeling/coding | Cartoning/case packing (incl. robotic case packers) | Wrapping | Palletizing (incl. cobot palletizers) | Inspection (vision/X-ray/checkweigh)
By application: Food (snacks, bakery, frozen) | Beverage (water, CSD, dairy) | Pharma (blister, bottle, serialization-related inspection) | Personal care | Chemicals
By region: North America (automation + compliance upgrades) | Western Europe (sustainability + energy + compliance) | Asia Pacific (capacity build + scaling automation) | Latin America (modernization) | MEA (selective growth + service/training focus)
TL;DR: Most buying decisions can be quickly framed by machine type, application compliance needs, and whether the region is replacement-led or new-capacity-led.
Market Challenges and Risks (What Can Derail Forecasts)

Packaging machinery projects face constraints that can delay capex approvals or slow deployments:
- High initial capex and longer approval cycles when interest rates or cash flow tighten
- Skilled maintenance shortages (controls, servo tuning, robotics programming)
- Integration complexity across OEM equipment, legacy PLCs, conveyors, and plant IT
- Supply chain volatility (electronics, drives, stainless components) and long lead times
- Energy price swings affecting TCO and sustainability ROI calculations
- Cybersecurity risk in connected machines and remote access setups
- Regulatory shifts that change packaging material specs (sealants/films) and force revalidation
TL;DR: Capex cycles, labor/skills, integration, lead times, energy, cybersecurity, and regulatory shifts are the main risks that can slow market growth or disrupt project ROI.
Research Methodology, Assumptions, and Limitations
Market sizing typically blends primary interviews (OEMs, integrators, end-users) with secondary sources (annual reports, trade data, technical publications). Forecast models frequently assume stable macro conditions and standard equipment replacement cycles. The market numbers cited here are consistent with CMI’s 2024 analysis and should be treated as nominal projections unless the underlying dataset states inflation-adjusted (“real”) values.
Key limitations to keep in mind: (1) different firms classify machine categories differently (e.g., whether inspection is inside “packaging machinery”); (2) revenue attribution varies for integrated lines vs. standalone machines; (3) FX (foreign exchange) swings can distort regional comparisons; and (4) step-changes in regulation (EU packaging waste, food safety enforcement) can accelerate or delay spending.
TL;DR: Figures depend on category definitions, revenue attribution, and macro/FX assumptions; treat forecasts as nominal unless explicitly stated and expect variance when comparing across research providers.
Conclusion: Actionable Strategic Takeaways (2025–2032)

- Prioritize flexibility upgrades where SKU churn is high: invest in servo-driven platforms, tool-less change parts, and recipe management to cut changeover time and lift OEE—especially for snacks, RTD beverages, and personal care.
- Target end-of-line automation for fast ROI: robotic case packers and palletizing (including cobot palletizers) frequently deliver 12–36 month payback where labor availability, ergonomics, and throughput stability are pain points.
- Build “recyclable-ready” sealing and material capability: validate seals on mono-material films and lightweight packs to align with Europe’s packaging waste direction and brand sustainability commitments.
- Design compliance and safety in from day one: plan for ISO 13849/14119 safety architecture, hygienic design (EHEDG/3-A where relevant), and for pharma, Part 11-ready electronic records where applicable.
- Invest in IT/OT integration and cybersecurity: connect packaging assets to MES/ERP with a defined data model, remote diagnostics, and secure access controls to reduce downtime while managing cyber risk.
TL;DR: Win with flexibility (servo + fast changeover), automate end-of-line for ROI, prepare for recyclable materials, embed safety/compliance early, and integrate securely with MES/ERP.
FAQ
Q: What’s the difference between primary, secondary, and tertiary packaging machinery?
A: Primary packaging machinery forms/fills/seals packs in direct contact with the product (e.g., FFS, fillers, blister machines). Secondary packaging machinery groups those packs (cartoners, case packers, shrink bundlers). Tertiary packaging machinery prepares goods for logistics (palletizers, stretch wrappers, pallet labeling).
Q: How do automatic form-fill-seal machines for snacks differ from other FFS applications?
A: Snack FFS lines typically require high-speed sealing on films, strong seal integrity to protect freshness, nitrogen flush capability in some cases, and rapid changeovers for multiple bag sizes. They also commonly integrate checkweighing and vision code verification to reduce giveaway and compliance risk.
Q: What should I look for when buying robotic case packers for a mixed-SKU line?
A: Evaluate gripper flexibility, changeover method (tool-less vs. tooling swaps), vision guidance capability, payload and reach margins, upstream product orientation control, and how the robot cell reports downtime and faults to your MES. Also confirm guarding/safety design meets ISO 13849 requirements and your site standards.
Q: How do EU packaging waste rules affect packaging machinery specifications?
A: They increase demand for machines that can handle recyclable materials (often different seal windows and stiffness), support downgauged/lightweighted structures without damaging packs, and provide better process control for consistent seals. Many buyers now require material test runs and documented seal validation during FAT/SAT (Factory/Site Acceptance Testing).
Q: What payback period is realistic for packaging line automation upgrades?
A: Many end-of-line automation projects target roughly 12–36 months depending on labor costs, uptime constraints, and product mix. The main ROI levers are labor reduction or redeployment, reduced downtime, higher sustained throughput, and lower scrap/rework from improved inspection and process control.