Introduction

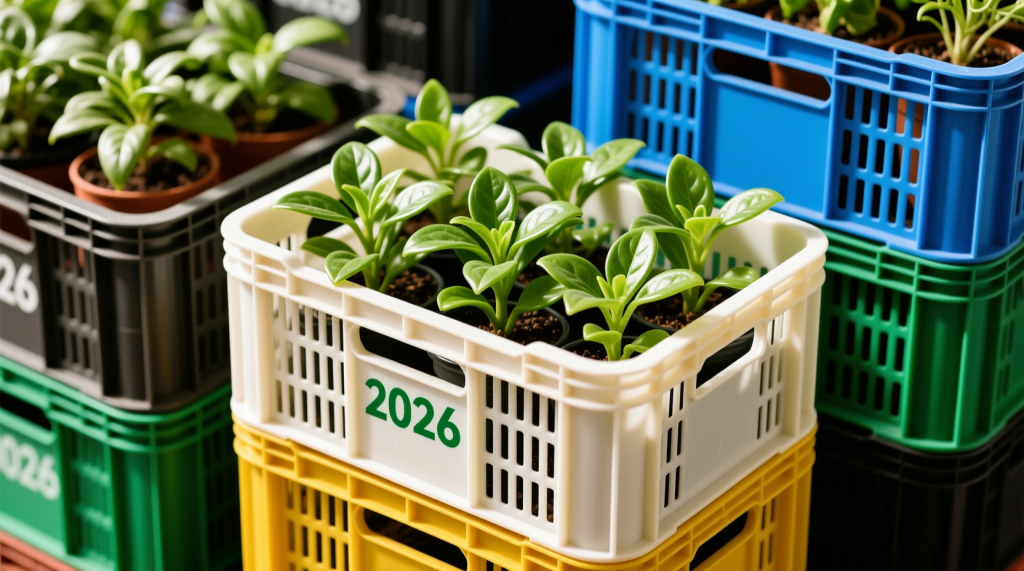
Setting up a plastic crate manufacturing plant in 2026 positions investors in a practical, operations-driven segment of returnable plastic packaging investment rather than a purely “trend” market. Plastic crates are a subset of RTP (Returnable Transit Packaging)—durable containers designed to circulate repeatedly through supply chains (as opposed to single-use cartons).
Demand is being pulled by agriculture and fresh produce handling, dairy and beverage distribution, retail and e-commerce fulfilment, pharmaceutical cold chain, and industrial warehousing. These sectors value crates for repeatability (standard footprints), washability, compatibility with conveyors/automation, and lower damage rates compared with improvised packaging.
At the same time, the business is not frictionless: mould lead times can run long, pooling systems can suffer from crate theft/loss, and regulatory scrutiny around plastics is increasing—especially where “single-use” bans are misunderstood and spill over into durable products. A feasibility-driven plan (product mix + plant layout + offtake contracts) matters more than broad market optimism.
TL;DR: Plastic crate manufacturing is a repeat-use logistics play with real operational challenges (moulds, pooling losses, regulation). Success depends on product/contract strategy and execution, not slogans.
Market Overview and Growth Potential
The global plastic crates market is expected to grow steadily. IMARC estimates the market at about USD 6.17 billion (2025) and projects it could reach approximately USD 8.78 billion by 2034 (about 4.0% CAGR during 2026–2034). Source: IMARC Group – Plastic Crates Market.
Growth drivers differ by region:
- Developed markets: tighter food safety expectations, higher labour costs that justify automation-compatible crates, and stronger compliance requirements (traceability, standardized footprints).
- Emerging markets: expansion of cold chain and organized retail, modernization of produce supply chains, and import substitution where crates are currently shipped in from hubs.
Regulatory context increasingly shapes demand and design choices. In the EU, packaging policy is moving toward waste prevention, reuse, and EPR (Extended Producer Responsibility—fees/obligations on producers for end-of-life). See: European Commission – Packaging Waste and the broader framework under the OECD – Extended Producer Responsibility. Durable crates usually benefit from “reuse” logic, but compliance documentation (materials, recycled content claims, marking) is becoming more important.
Less-discussed market friction points that directly impact plant feasibility:
- Pooling system losses: crates used in pooled/return loops can be lost, stolen, or hoarded at retail endpoints—raising replacement demand but lowering customer willingness to pay without tracking (barcode/RFID).
- Seasonality: agriculture peaks can overload capacity; beverage crates can spike during summer; underutilization in off-peak months hits ROI.
- Specification creep: large customers may require testing, audited QA systems, and tight dimensional tolerances for automation—raising tooling and QC costs.
Section recap (Market):
- Demand growth is steady, but ROI depends on utilization and customer contracts.
- Developed markets pull for automation + compliance; emerging markets pull for cold chain + modernization.
- Pooling losses and seasonality are real operational/financial variables, not side notes.
TL;DR: Market growth is real, but plant economics are driven by utilization, customer specs, and regional policy (reuse/EPR), plus practical pooling losses.
Product Overview: Plastic Crates, Materials, and Design Advantages
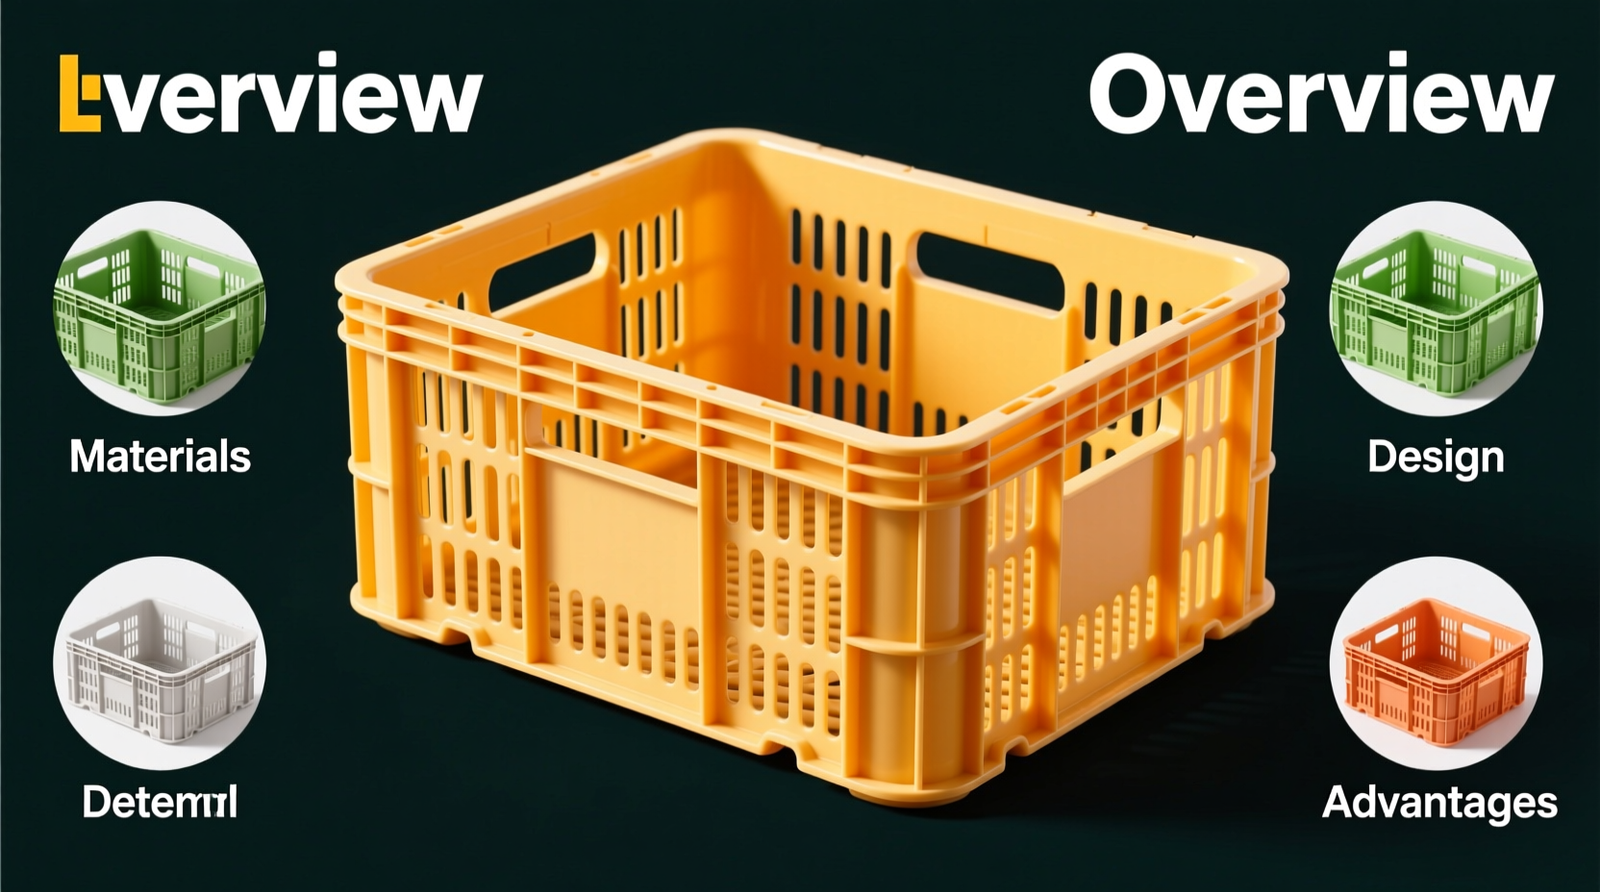
Plastic crates are rigid containers typically made via injection moulding (high-pressure molten polymer injected into a metal mould) using HDPE (High-Density Polyethylene) or PP (Polypropylene). HDPE is often chosen for impact resistance and toughness at lower temperatures; PP can offer higher stiffness and heat resistance, depending on grade and design.
Common product families (and what drives pricing):
- Vented agriculture crates: airflow + low weight, often price-sensitive and high volume.
- Dairy & beverage crates: higher structural demands for stacking, brand/logo requirements, and consistent dimensions.
- Nestable/stackable totes for retail DCs: dimensional precision for conveyors, dividers, and automation interfaces.
- Heavy-duty industrial crates/bins: thicker walls/ribs, higher load ratings, sometimes anti-static needs.
Comparative note: plastic vs wooden/metal crates (life-cycle viewpoint)
- Hygiene: plastic is easier to wash/disinfect than wood; critical in food and pharma logistics.
- Handling efficiency: consistent dimensions suit conveyors and automated storage; wood varies and can snag.
- Life-cycle cost: plastic typically wins when reuse cycles are high and loss rates are controlled; metal can last longer but is heavier, can dent, and often costs more upfront.
HDPE crate design is where differentiation often happens: rib patterns, stacking rim geometry, base flatness, and warpage control determine whether a crate “behaves” in real logistics (stacking stability, conveyor tracking, drop survivability, wash cycles).
TL;DR: HDPE/PP crates compete on durability, hygiene, and automation compatibility; design details (ribs, rims, flatness) drive performance and customer acceptance.
Key Market Drivers (with Practical Constraints)
Returnable Transit Packaging (RTP) replacing one-way packaging
RTP adoption is driven by total cost of ownership, damage reduction, and operational repeatability. However, many RTP programs fail to hit targets due to reverse logistics leakage—losses at retail, misrouting, and poor accountability. For plant owners, this creates two realities: (1) replacement demand can be steady, and (2) customers will increasingly insist on tracking features (barcode plates, RFID pockets) and anti-tamper/branding.
Cold chain expansion and food safety requirements
Cold chain growth lifts demand for wash-down capable crates. In many regions, government or development-bank programs support cold storage and refrigerated transport, indirectly growing demand for standardized crates. Where food safety enforcement is stricter, customers are more likely to specify material declarations, traceability markings, and documented cleaning compatibility.
Organized retail and e-commerce fulfilment
Retail distribution centres value nestable crates to reduce empty-return volume. But they also impose strict dimensional tolerances for automated sortation and conveyors—pushing manufacturers toward better mould design, process controls, and quality testing.
Sustainability and circular economy pressure (and regulatory risk)
Regulators increasingly focus on reducing packaging waste. Durable crates typically align with reuse goals, but the “plastics” narrative can still create procurement and reputational risk. Plants that can demonstrate recycled content (where allowed), end-of-life recyclability, and low scrap rates will be better positioned.
TL;DR: Drivers are strong, but real-world constraints (reverse logistics leakage, tighter specs, sustainability scrutiny) influence design, pricing, and customer selection.
Plant Capacity, Product Mix, and Injection Moulding Plant Layout
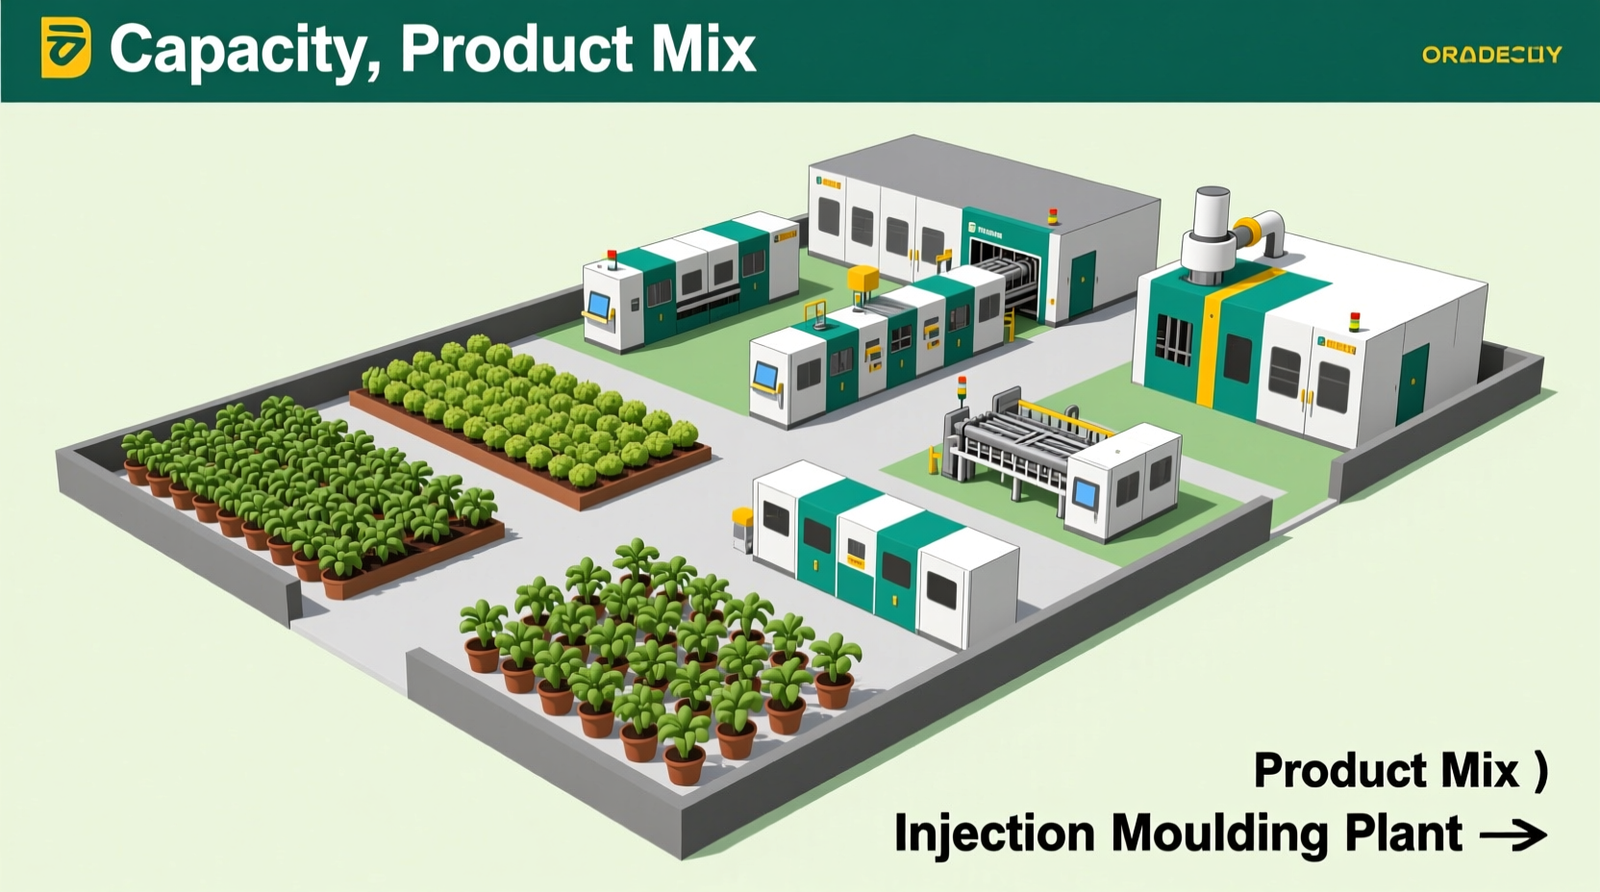
A target capacity of 1–2 million crates/year can work, but feasibility depends on SKU strategy and moulding cycle times. Crates are bulky; handling and warehouse flow often become the bottleneck before injection capacity does.
Key decisions for injection moulding plant layout:
- Material flow: resin silos/bags → conveying → gravimetric blending → moulding → cooling buffer → inspection/printing → stacking/palletizing → finished goods staging.
- Mould handling: overhead crane paths, mould storage racks, and a dedicated mould maintenance bay (cleaning, polishing, hot runner checks).
- Space for buffers: large parts may require post-mould cooling/conditioning to stabilize dimensions.
- Dispatch geometry: dock doors and staging sized for bulky pallet stacks; poor dispatch design quickly creates congestion.
Product mix strategy typically falls into two models:
- Few high-volume SKUs: better utilization and lower changeover losses; less customer diversity.
- Broader portfolio: diversified demand but more mould inventory, changeovers, QA complexity, and higher working capital.
TL;DR: Capacity planning is really utilization + SKU strategy + flow/warehouse design; crates are bulky, so layout and dispatch can make or break throughput.
Financial Viability, ROI, and Unit Economics (Indicative Ranges)
Below are indicative investment and return ranges commonly seen in a plastic crate manufacturing feasibility report. Actual outcomes vary by country, energy tariffs, resin sourcing, mould sourcing (in-house vs outsourced), automation level, and customer requirements. Treat these as planning bands—not quotes.
Indicative CapEx (Capital Expenditure) bands
- Small plant (0.3–0.7 million crates/year): ~USD 1.5–4.0 million (typically 1–2 injection moulding machines, limited automation, fewer moulds).
- Medium plant (1–2 million crates/year): ~USD 4–12 million (2–5 machines, more mould sets, chillers/compressors sized for uptime, basic robotics/stackers, stronger QC lab).
- Large plant (3–6+ million crates/year): ~USD 12–30+ million (multiple high-tonnage machines, higher automation, larger mould library, higher power infrastructure, stronger tooling maintenance, potential in-house compounding/regrind systems).
Major CapEx drivers include: number/size of injection machines, mould count and complexity (especially hot runners), automation for demoulding/stacking, utilities (chillers, compressors), and building/cranage for mould changes.
Typical ROI metrics (benchmark-style)
- Payback period: often 3–6 years for well-utilized plants with stable offtake; longer if utilization is low or mould spending is front-loaded.
- Project IRR (Internal Rate of Return): commonly 15–25% in base-case assumptions; can drop below low teens when utilization weakens or resin spikes without pass-through.
Simple unit economics example (illustrative only)
Assume a standard crate weighs 1.2–2.5 kg depending on size/design. Resin often dominates variable cost.
- Agriculture vented crate (price-sensitive):
- Indicative manufacturing cost: ~USD 3–7 per crate
- Indicative selling price band: ~USD 4–10 per crate
- Industrial heavy-duty crate/bin (higher performance):
- Indicative manufacturing cost: ~USD 8–20 per crate
- Indicative selling price band: ~USD 12–30+ per crate
What moves these bands the most: resin grade and pricing, part weight, cycle time, scrap rate, automation labour savings, and whether the customer requires certification/testing/branding features.
Quick sensitivity discussion (why feasibility models fail in practice)
- Resin cost ±10%: if resin is ~60–70% of OpEx, a +10% resin move can compress gross margin sharply unless your contracts allow pass-through or indexed pricing.
- Utilization rate ±10%: because depreciation, overhead, and staffing are relatively fixed, a 10% drop in utilization can reduce EBITDA disproportionately—especially in higher CapEx, automation-heavy plants.
Section recap (Financials):
- Medium (1–2 million/year) plants commonly land in ~USD 4–12 million CapEx bands (highly case-dependent).
- Payback often targets 3–6 years; IRR commonly benchmarked ~15–25% with stable utilization.
- Resin volatility and utilization swings are the two fastest ways to break the model.
TL;DR: Financial success depends more on utilization + resin pass-through than on headline market growth; build a sensitivity model early.
Manufacturing Process and Technical Depth (Injection Moulding)
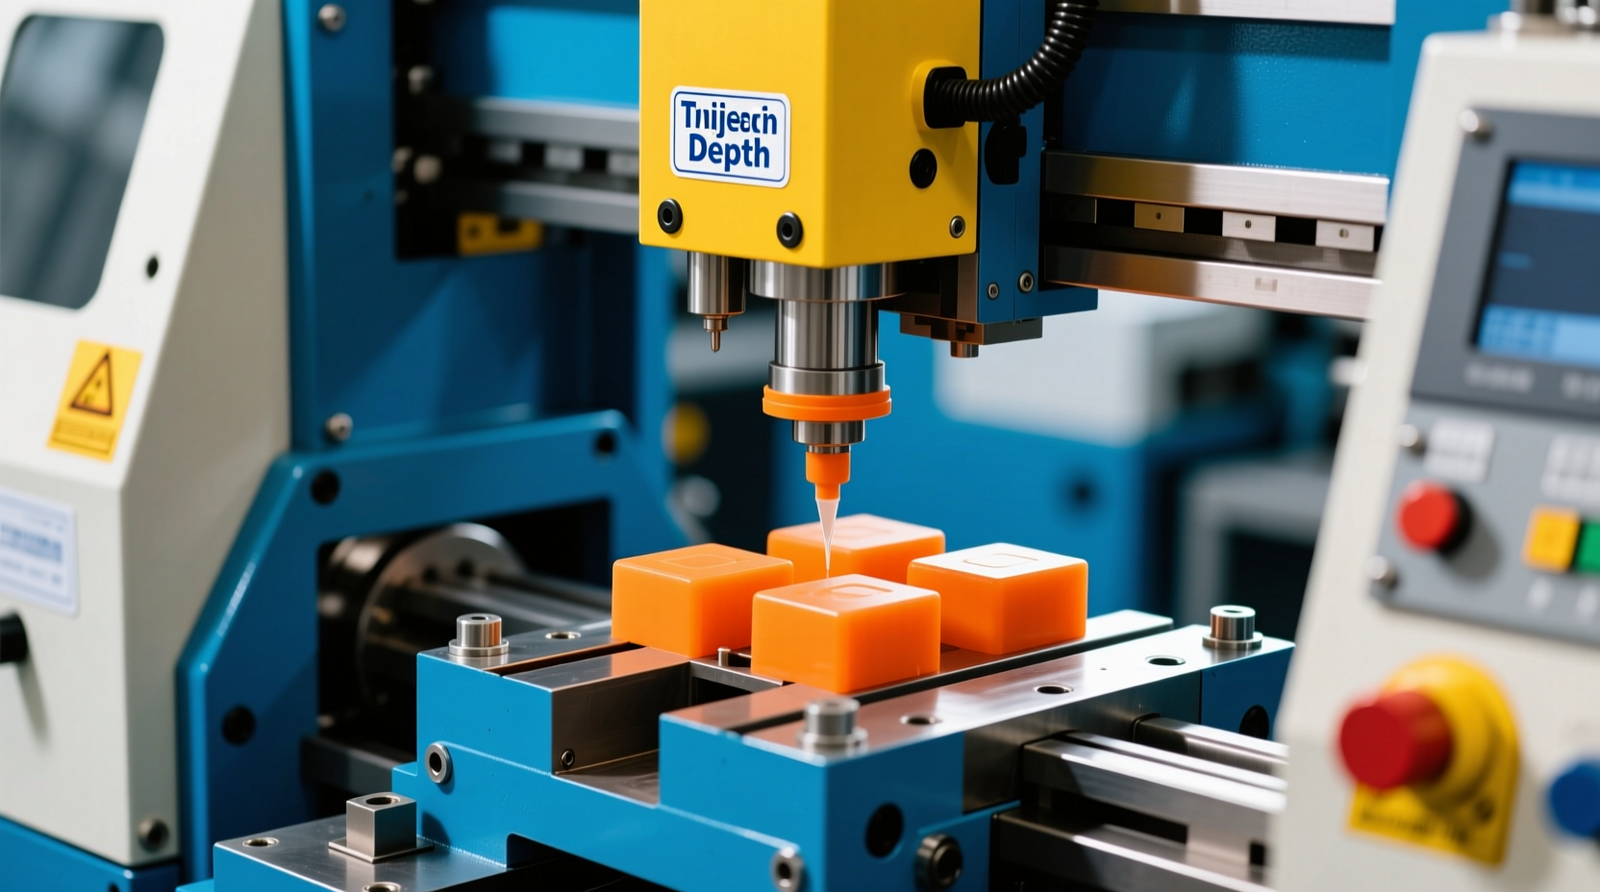
A modern plastic crate plant is essentially a high-throughput injection moulding operation with tight control of cycle time, warpage, and stacking geometry.
1) Resin preparation and dosing
HDPE/PP pellets are blended using gravimetric blenders (weight-based dosing) with masterbatch (colour concentrate) and additives (e.g., UV stabilizers). For non-food applications, controlled use of regrind/recyclate can reduce cost but requires tighter QC to avoid brittleness and odour issues.
2) Melt processing (typical temperatures and controls)
Indicative melt temperature windows (varies by grade):
- HDPE: ~180–230°C
- PP: ~200–250°C
Key controls include melt temperature stability, back pressure, screw recovery, and mould temperature management. Poor thermal control shows up as warpage, sink marks (surface depressions over thick ribs), and inconsistent stacking fit.
3) Tooling: mould steel, lead time, and mould life
Mould performance is often the decisive factor for OEE (Overall Equipment Effectiveness—availability × performance × quality). Common mould steels include P20 (pre-hardened tool steel) and hardened grades such as H13 / 1.2344 depending on design and expected volumes. Crate moulds are large, complex, and can have long lead times; 12–24+ weeks is common depending on cavity count, hot runner complexity, and supplier load.
Expected mould life can range widely (e.g., 0.5–2+ million cycles with proper steel selection and maintenance), but real-world life is dominated by cooling circuit scaling, gate wear, ejector wear, and damage during mould changes.
4) CAE, simulation, and FEA-driven crate design
To reduce costly trial-and-error, advanced plants use CAE (Computer-Aided Engineering) tools for:
- Moldflow simulation: predicting fill, pressure, weld lines, air traps, and cooling imbalances that drive warpage.
- FEA (Finite Element Analysis): optimizing ribbing, stacking rims, and base geometry to meet compression/stack load targets without overweighting the part.
This is particularly valuable in large crates where minimizing warpage and maintaining base flatness impacts conveyor tracking and stacking stability.
5) Quality standards, test methods, and typical benchmarks
Customers may specify tests aligned to ISO (International Organization for Standardization) or ASTM (ASTM International) methods depending on region and industry. Examples of widely used test references include:
- Compression testing: e.g., ASTM D642 (compressive resistance of shipping containers).
- Impact/drop testing: commonly based on ASTM/ISO approaches depending on packaging type and agreement (drop heights, orientations, temperature conditioning).
Authoritative references: ASTM D642 overview and ISO standards portal (standard selection depends on crate type and customer specs).
Indicative performance expectations (varies heavily by design and size): standard logistics crates may be specified for static stacking loads in the hundreds of kilograms to >1,000 kg range per stacked column under defined conditions; heavy-duty industrial bins can be higher. Always define: test duration, temperature conditioning (cold brittleness matters for HDPE/PP), load application method, and pass/fail deformation limits.
6) Maintenance regime (often underestimated)
Crate plants with high uptime typically run a structured programme:
- Daily/shift: gate/ejector checks, cooling flow verification, quick cleaning.
- Weekly: hot runner inspection (where applicable), vent cleaning, sensor checks.
- Planned shutdowns: descaling cooling circuits, polishing, ejector replacement, alignment verification.
Maintenance constraints are a common bottleneck: if toolroom capacity is undersized, cycle time drifts, scrap rises, and delivery reliability suffers.
Section recap (Manufacturing):
- Control melt temperature, cooling balance, and warpage—stacking fit is a “must-pass” metric.
- Mould steel choice + maintenance discipline largely determine uptime and part consistency.
- CAE/FEA reduces overweight designs and shortens time-to-stable production.
TL;DR: The technology is “standard injection moulding,” but crate success is tooling + warpage control + maintenance capacity + test discipline.
Cost Structure (OpEx) and Setup Considerations (CapEx)
Operating costs (OpEx)
Typical operating cost structure (varies by region and automation level):
- Raw materials: ~60–70% (HDPE/PP, masterbatch, additives, potential recyclate)
- Utilities: ~15–20% (power for heaters/drives, chillers, compressors)
- Labour + maintenance + overhead: balance
Cost levers that meaningfully affect margin:
- Scrap/reject rate: even a 1–2% improvement matters at scale; but regrind use must be controlled to avoid brittle failures.
- Energy efficiency: servo drives, optimized barrel heating, and well-sized cooling systems can reduce kWh/crate.
- Changeover time: product mix decisions directly affect downtime and labour.
Capital costs (CapEx) and decision points
- In-house vs outsourced mould making: in-house improves response time and IP control but requires skilled toolmakers and machines; outsourcing reduces CapEx but can create long lead times and slower design iterations.
- Automation level: manual handling is cheaper upfront but risks damage, variability, and labour exposure; robots/stackers improve consistency but raise CapEx and maintenance skill requirements.
- Utilities sizing: undersized chillers and compressors cause cycle time drift, warpage, and downtime—often more costly than the initial savings.
TL;DR: Resin and utilities dominate OpEx; mould strategy, automation, and utilities sizing are the biggest “early” CapEx decisions that determine long-run cost per crate.
Major Applications and Target Segments (with Buying Criteria)

Agriculture and fresh produce
Buyers prioritize ventilation, stack stability, low damage rates, and price. Government programmes targeting post-harvest loss reduction can support demand, but volumes are seasonal, and rough handling increases return rates—meaning impact performance matters.
Dairy and beverage
Buyers prioritize stacking strength, wash-down durability, and consistent dimensions for line and warehouse handling. Branding and anti-counterfeit markings are common. Crate pools also face high loss rates at retail endpoints unless controls exist.
Retail, supermarket, and e-commerce logistics
Buying criteria include nestability ratio (empty return efficiency), conveyor/automation compatibility, ergonomic handles, and tracking features (barcode/RFID). Dimensional tolerances and base flatness become more critical than in purely manual supply chains.
Pharmaceutical and cold chain
Here, the “crate” may be part of a validated system (insulated shipper, cold packs, tamper evidence). Requirements can include documentation, traceability, and compatibility with cleaning/disinfection protocols.
Industrial and automotive
Buyers prioritize load ratings, durability, sometimes ESD (Electrostatic Discharge) control (anti-static compounds), and precision to fit racks and automated lines.
Section recap (Applications):
- Agriculture = high volume, seasonal, impact resistance critical.
- Beverage/dairy = stacking + branding + pooling loss considerations.
- Retail/e-commerce = automation fit + nestability + tracking.
- Industrial = heavy-duty performance and sometimes ESD requirements.
TL;DR: Each segment buys for different reasons; product mix should match your plant’s tooling, QA capability, and sales cycle—not just “market size.”
Implementation Roadmap (Staged Plan with Indicative Timelines)
A realistic rollout plan reduces cost overruns and “early scrap” during ramp-up:
- Stage 1: Concept & feasibility (4–8 weeks) – segment selection, competitor mapping, preliminary unit economics, resin sourcing plan, plastic crate manufacturing feasibility report draft.
- Stage 2: Detailed engineering (6–10 weeks) – injection moulding plant layout, utility sizing, QC lab plan, toolroom scope, EHS (Environment, Health & Safety) planning.
- Stage 3: Procurement (8–20+ weeks) – machines, robots/stackers, chillers/compressors, and especially moulds (often the longest lead item).
- Stage 4: Installation & commissioning (4–8 weeks) – electrical, chilled water, compressed air, conveying, trials.
- Stage 5: Pilot runs & validation (4–12 weeks) – process windows, capability studies, customer testing, packaging and pallet patterns.
- Stage 6: Commercial ramp-up (3–9 months) – yield improvements, cycle time optimization, supplier stabilization, contract scaling.
Decision checkpoints to lock early:
- Mould sourcing route (local vs overseas; in-house maintenance capability).
- Automation scope (manual take-off vs robot + stackers + palletizing).
- Product mix (few SKUs vs broad catalogue; food-grade vs industrial lines).
TL;DR: Expect ~6–12+ months from feasibility to stable commercial output; mould lead times and process stabilization usually define the critical path.
Workforce Plan and Training Needs

Headcount depends on automation, number of shifts, and mould change frequency. As a practical baseline for a medium plant (1–2 million crates/year), typical roles include:
- Production: machine operators/technicians per shift, shift supervisors, material handlers.
- Tooling: mould maintenance technicians/toolmakers (critical for uptime), crane/forklift-certified staff.
- Quality: QC inspectors, a quality engineer for testing plans, calibration, and customer audits.
- Utilities & maintenance: electrical/mechanical maintenance techs for chillers, compressors, robots.
Training priorities:
- Process discipline (startup/shutdown, parameter control, defect recognition).
- Mould handling safety and changeover procedures.
- Test methods and documentation (compression/drop/stack tests; traceability records).
TL;DR: Tooling and maintenance skills are often the limiting resource; plan training and spares early to protect uptime and quality.
Major Risks and Mitigation Strategies
- Resin price volatility: mitigate via indexed customer pricing, diversified suppliers, safety stock strategy, and (where feasible) financial hedging tied to polymer feedstocks.
- Demand cyclicality/seasonality: balance agriculture with industrial/retail SKUs; use staggered production planning and flexible shift models.
- Customer concentration: avoid building the plant around a single anchor buyer without enforceable volume commitments; pursue multi-sector portfolios and multi-year offtake agreements.
- Regulatory pressure on plastics: document reuse cycles, recyclability, and (where allowed) recycled content; align claims with local rules and EPR requirements. Reference frameworks: European Commission – Single-Use Plastics (note: durable crates are generally not “single-use,” but policy spillover risk exists).
- Competition from pooling providers and established moulders: differentiate through lead time, local service, customization, QA/testing, and tracking-ready designs. Consider partnering with logistics providers rather than competing head-on with full pooling models.
- Pooling theft/loss: support customers with RFID-ready designs, unique IDs, and data integration; design for repairability to reduce replacement cost.
TL;DR: The main risks are resin volatility, utilization swings, customer concentration, regulation optics, and pooling losses—each can be mitigated with contracts, diversification, tracking, and strong QA.
Industry Landscape and How New Entrants Can Compete
The market includes global returnable packaging suppliers and local injection moulders. Notable players include Schoeller Allibert, ORBIS, and CHEP (Brambles). References: Schoeller Allibert, ORBIS Corporation, CHEP.
A new plant typically wins when it chooses battles carefully:
- Service edge: faster mould modifications, faster replacement supply, on-site trials with customer conveyors/automation.
- Design-to-cost: using CAE/FEA to cut weight without failing stack/impact specs.
- Quality credibility: consistent testing, documented process windows, and audit readiness.
- Localized economics: lower freight and faster supply to bulky-demand clusters (produce markets, beverage bottlers, DC corridors).
TL;DR: Competing with large players is feasible when you win on local responsiveness, design-to-cost engineering, and audited quality—not by racing to the lowest price.
Conclusion
A plastic crates manufacturing plant in 2026 can be a solid industrial project when the plan is built around utilization, tooling realism, and customer logistics—not just market CAGR. Investors should focus on the following takeaways:
- Lock location and logistics: proximity to bulky-demand corridors reduces freight and improves service levels.
- Engineer for cost and automation: use CAE/FEA to meet load/stack targets at competitive weight; design for conveyors and tracking features.
- Protect margins structurally: resin pass-through mechanisms, diversified product mix, and disciplined maintenance/QC matter more than optimistic pricing.
- De-risk ramp-up: plan for mould lead times, validation runs, and workforce/toolroom capability from day one.
TL;DR: The winners optimize location, tooling/maintenance, energy and cycle time, and contract structure—then execute ramp-up without quality drift.
FAQ

Q: What is a realistic investment range for a 1–2 million crates/year plant in 2026?
A: Indicatively, a medium-scale plant often falls around USD 4–12 million in CapEx, depending on the number/tonnage of injection moulding machines, mould count and complexity (often the longest lead item), automation (robots/stackers), utilities, and building/cranage needs. Actual costs vary significantly by country and supplier choices, so a site-specific DPR and quotations are essential.
Q: What payback period and IRR can plastic crate manufacturing achieve?
A: Well-utilized plants with stable offtake contracts commonly target ~3–6 years payback and ~15–25% project IRR under benchmark assumptions. Returns can fall quickly if utilization drops, resin costs rise without price pass-through, or mould/maintenance issues increase downtime.
Q: Which technical standards and tests are commonly referenced for plastic crates?
A: Buyers frequently require compression/stacking and impact/drop performance validation using ISO/ASTM-aligned methods. For example, ASTM D642 is commonly referenced for compression resistance of shipping containers. The exact standard and acceptance criteria depend on the crate type, load case, conditioning temperature, and customer automation requirements.
Q: How can a new plastic crate plant compete with global players and established pooling providers?
A: New entrants usually compete by being faster and more local: shorter lead times, rapid mould modifications, design-to-cost engineering (using CAE/FEA to reduce weight while meeting load ratings), and reliable QC/testing documentation for audits. Partnering with regional logistics providers or cooperatives can also help access demand without building a full pooling network from scratch.
Q: Can plastic crates use recycled content, and how does sustainability affect buying decisions?
A: Many non-food applications can incorporate recycled HDPE/PP (recyclate) if quality is controlled; food-contact uses may face stricter rules depending on region and regulation. Sustainability is increasingly evaluated through durability (reuse cycles), repairability, recyclability at end-of-life, and documentation for EPR/compliance reporting. Some buyers also request LCA (Life Cycle Assessment) evidence to compare reusable crates against single-use alternatives.