Meta overview: This Deere (DE) stock analysis covers the Q1 FY26 earnings update, where Deere may be in the ag/construction cycle, valuation versus history and peers, key support levels ($650 and $600–$615), and how DE might fit inside a diversified portfolio for traders and long-term investors.
Introduction: Who This Deere (DE) Stock Analysis Is For
Deere & Company (NYSE: DE) is a global leader in agricultural and construction equipment. After a sharp move to record highs following earnings, investors are debating whether the rally is mainly fundamentals (better earnings durability) or positioning/technical momentum.
This article is written for two profiles: (1) short-term traders (swing to position trades over days to a few months) focused on price levels, volume, and invalidation points; and (2) long-term investors (6–36+ months) focused on cycle dynamics, valuation versus history/peers, and portfolio sizing.
Important: All price levels referenced (e.g., ~$662, $650, $600–$615) are snapshots that can change quickly and should be re-validated with up-to-date charts and quotes before acting.
TL;DR: This is a dual-audience DE stock guide—traders get level-based tactics, investors get cycle + valuation context—using price levels that must be rechecked.
Deere Q1 FY26 Earnings (As-Reported): What Changed and Why It Mattered
As of the Q1 FY26 earnings release date and the immediate post-release trading window (figures discussed here are based on Deere’s Q1 FY26 earnings materials and contemporaneous market pricing), Deere reported earnings per share (EPS)—net profit per share—of $2.42 versus consensus expectations near $1.92. More market-moving than the quarterly beat was the full-year FY26 net income guidance increase.
- FY26 net income guidance: raised to $4.5B–$5.0B (from $4.0B–$4.75B).
- Small Agriculture & Turf: guided to roughly +15% YoY (year-over-year) sales growth.
- Construction & Forestry: guided to roughly +15% YoY sales growth.
The market took the guidance change as evidence that Deere’s earnings trajectory may be stabilizing even while Large Ag remains softer. That mix shift matters because it influences not just revenue volatility, but also segment margins (profitability by business line) and operating leverage (how much profits move when sales change).
For primary-source details, see Deere’s Investor Relations earnings releases and presentations: https://investor.deere.com/.
TL;DR: The key takeaway wasn’t only a quarterly EPS beat; it was higher FY26 profit guidance and a mix leaning toward Small Ag + Construction, which can change near-term earnings stability.
Cycle Signals You Can Verify: Inventories, Backlogs, Used Equipment, and Financing

“Cycle bottom” narratives become more credible when they align with measurable indicators investors can track. In heavy equipment, four practical checks tend to matter:
- Dealer inventory: When dealer lots normalize after being overstocked, OEMs (original equipment manufacturers) often regain pricing power and production visibility.
- Order backlog: A stabilizing or improving backlog can indicate that end demand is absorbing production, even if one sub-segment (like large ag) is weak.
- Used equipment pricing: Used price stability supports trade-in values and customer affordability, which can protect new equipment demand.
- Financing conditions: Higher rates can pressure equipment affordability; easing credit spreads or stable captive finance performance often helps demand.
On the macro side, farm economics and construction activity are key demand drivers. For farm income context, the USDA publishes regular updates on U.S. net farm income and balance sheet trends: https://www.ers.usda.gov/topics/farm-economy/farm-sector-income-finances/. For construction demand context, U.S. housing and construction indicators can be monitored through sources like the U.S. Census Bureau (housing starts/building permits): https://www.census.gov/construction/nrc/.
For infrastructure-related tailwinds, investors often reference U.S. federal spending frameworks (e.g., IIJA). A neutral overview is available at the U.S. Department of Transportation: https://www.transportation.gov/bipartisan-infrastructure-law.
TL;DR: Treat “cycle bottom” as a testable claim—watch dealer inventory, backlog, used equipment pricing, and financing, plus USDA farm income and construction indicators.
Deere’s Technology Stack: Precision Ag, Software, and Subscription-Like Revenue
One reason investors argue Deere may be less cyclical than in past decades is the expansion of its technology platform. Precision agriculture (precision ag) refers to using GPS, sensors, data analytics, and automation to optimize inputs like seed, fertilizer, and chemicals. Deere has invested heavily in guidance, autonomy/automation features, machine connectivity, and farm operations software.
In practice, a stronger software and connected-services layer can change cyclicality in three ways:
- Higher switching costs: Integrated workflows (machine + data + agronomic decisions) can increase customer retention.
- More recurring revenue: Software/service subscriptions and digital tools can smooth results versus purely one-time equipment sales.
- Value proposition in down cycles: When farm income is pressured, ROI-focused tech that reduces input costs can remain attractive.
This does not eliminate cyclicality—large equipment replacement cycles and commodity-linked demand still matter—but it can reduce the “all-or-nothing” feel of prior downcycles if recurring and technology-driven revenue expands as a share of the total.
For background on precision ag concepts and adoption, a practical reference is USDA/NASS (National Agricultural Statistics Service) and USDA research pages, alongside land-grant university extension research; a general starting point is USDA’s NASS site: https://www.nass.usda.gov/.
TL;DR: Deere’s precision ag + software strategy can add stickier, more recurring economics, potentially smoothing results versus older equipment-only cycles—though cyclicality still exists.
DE Stock Price Action (As of Recent Trading): What the Breakout Likely Reflected

As of the immediate post-earnings move, DE shares closed around $662 after gapping higher. Large, fast gaps after guidance increases often reflect multiple forces at once:
- Fundamental repricing: Investors update forward earnings assumptions after a higher guidance range.
- Positioning dynamics: Short covering can accelerate upside when results invalidate the bear case.
- Systematic flows: Trend and volatility-targeting strategies may add exposure after large upside moves with high volume.
How to interpret this over time: over 1–10 trading days, mechanical flows and momentum can dominate; over 1–6 months, the market typically re-anchors to order trends, margins, and whether guidance proves conservative or optimistic.
TL;DR: The gap to ~$662 likely blended fundamentals and positioning; momentum can drive days/weeks, but fundamentals usually dominate over months.
Valuation and Comparables: Deere vs. Its Own History and Peers (CNH, AGCO, CAT)
Valuation context matters more after a record-high breakout. Deere often trades at higher multiples than some ag-focused peers due to scale, brand, dealer network, financing capabilities, and technology positioning. That said, multiples can still overshoot if near-term earnings are at cyclical peaks—or undershoot at troughs.
As of the period around the post-Q1 FY26 rally, Deere’s market-implied valuation (using commonly cited metrics like forward P/E—price divided by next-12-month earnings—and EV/EBITDA—enterprise value divided by earnings before interest, taxes, depreciation, and amortization) appeared meaningfully above many “deep cyclicals,” but not unprecedented for a high-quality industrial franchise.
Because exact forward multiples change daily with price and analyst estimates, you should verify current values on a live market data source. Useful, widely used pages include:
- Deere valuation & multiples (example data source): https://www.morningstar.com/stocks/xnys/de/valuation
- Caterpillar comparables: https://www.morningstar.com/stocks/xnys/cat/valuation
- AGCO comparables: https://www.morningstar.com/stocks/xnys/agco/valuation
- CNH Industrial comparables: https://www.morningstar.com/stocks/xmil/cnh/valuation
How to interpret “re-rating” with some rigor:
- If DE’s forward P/E is above its 5- or 10-year median while earnings are still cyclically pressured, that’s a stronger sign of multiple expansion (the market paying more per dollar of earnings).
- If DE’s forward P/E is above history and above peers like CNH/AGCO while growth/margin durability is improving (software mix, better pricing discipline, stronger construction), that can be justified—but should be considered a higher-confidence thesis, not a default assumption.
- Price-to-book (P/B)—price divided by accounting book value—can be less informative for companies with significant intangible value and cycle-driven asset swings, but it’s still useful for comparing to the company’s own history.
Statistical significance (practical version): if the stock is trading >1 standard deviation above its typical 5–10 year valuation band (you can approximate this by looking at long-term multiple charts), expectations are less forgiving—execution risk rises.
TL;DR: After the rally, DE should be judged against its 5–10 year multiple ranges and against CNH/AGCO/CAT; if it’s well above its historical band, the market is assuming better durability than prior cycles.
Fundamentals: Mix Shift and What It Could Mean for Margins (Not Just Revenue)

Deere’s guidance highlights relative strength in Small Agriculture & Turf and Construction & Forestry versus Large Ag. Investors often focus on which segment grows faster, but the more durable stock outcomes typically come from whether the mix shift supports segment operating margins and smooths earnings volatility.
Why mix matters to margins:
- Large Ag: tends to be more cyclical and ticket-size sensitive; when demand drops, fixed-cost absorption can pressure margins.
- Small Ag & Turf: can benefit from a broader customer base and steadier replacement demand, which can reduce revenue swings and help maintain factory utilization.
- Construction & Forestry: can provide a different cycle driver (housing, non-residential construction, infrastructure), potentially offsetting ag downcycles.
However, offsets aren’t automatic. Construction can also slow if rates stay high or if non-residential activity weakens. That’s why tracking forward indicators (housing starts, construction spending, credit conditions) matters.
TL;DR: A shift toward Small Ag + Construction can improve margin stability via better utilization and diversification, but investors still need to monitor construction sensitivity to rates and activity.
Scenario Analysis (Bull/Base/Bear): What Would Have to Be True
The point of scenarios is not precise price targets; it’s to define what must happen operationally for today’s valuation to make sense.
- Bull case (12–24 months): Large Ag stabilizes faster than expected, construction remains resilient, and technology-driven revenue grows. In this case, the market can justify a higher-than-historical multiple because earnings volatility declines. Price implication: upside can persist if earnings revisions stay positive and the stock holds above key support on pullbacks.
- Base case: Construction and Small Ag hold up, Large Ag remains soft but not collapsing, and margins are “okay” rather than expanding. Here, returns depend more on earnings delivery than multiple expansion. Price implication: the stock may consolidate and rotate, with pullbacks bought near support if guidance remains intact.
- Bear case: Farm income pressure lasts longer, used equipment prices weaken, and financing costs restrain demand; construction rolls over due to tighter financial conditions. In this setup, earnings expectations fall and the multiple can compress back toward historical medians. Price implication: larger drawdowns become more likely, especially if the stock loses prior breakout support on heavy volume.
TL;DR: Bull = better durability and positive revisions; base = consolidation while fundamentals prove out; bear = earnings cuts + multiple compression if farm/construction weaken together.
Key Support Levels, Risk/Reward, and Entry Points for Deere (DE) Stock
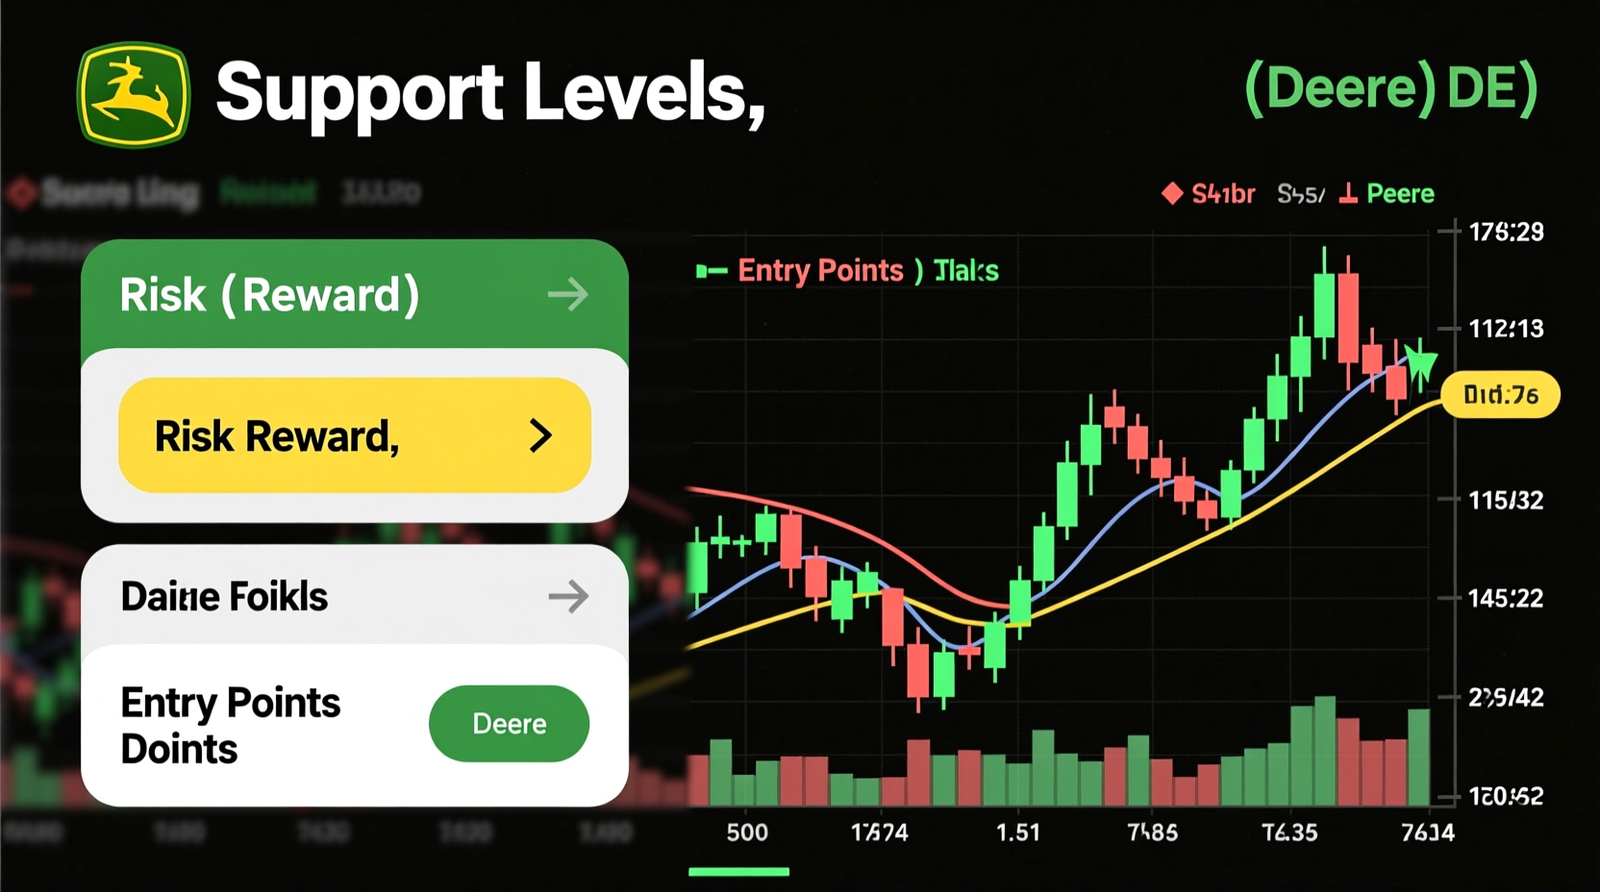
These levels are educational and must be re-validated with current charts. As of the post-earnings breakout context discussed earlier, traders and investors frequently referenced:
- ~$662 area: the breakout/all-time-high zone; watch whether price can consolidate above it (constructive) or fail back below it (risk of bull trap).
- $650: a major psychological level; often acts as a “line in the sand” for near-term trend followers.
- $600–$615: prior resistance zone that may act as first deeper support if the stock retests the breakout.
Actionable guidance for traders (not investment advice):
- Swing trades (days to ~6 weeks): many traders prefer either (a) a tight consolidation above $650 with declining volume (healthy) followed by a high-volume continuation, or (b) a pullback into $600–$615 that holds and then reclaims $650.
- Common stop-loss logic: traders often place stops just below the invalidation level for their setup (for example, below $650 for tight breakouts, or below $600 if trading the deeper support). The idea is to define risk before entry rather than “hoping it comes back.”
- Breakout invalidation signals: (a) a decisive close below $650 followed by failed retests, (b) heavy-volume selling that slices through $600–$615, or (c) a gap-up reversal (“up then down”) that fails to reclaim the breakout zone within several sessions.
Actionable guidance for long-term investors:
- More attractive entry conditions: often include either a pullback of ~10%–20% from the highs (if fundamentals remain intact) or a valuation reset where forward multiples revert closer to Deere’s historical median band.
- Staging entries: consider scaling in (e.g., 2–4 tranches) rather than buying all at once after a large gap move.
TL;DR: Traders can use $650 and $600–$615 for defined-risk setups and clear invalidation; investors may prefer staged buys on a 10%–20% pullback or a multiple reversion toward historical medians.
Risks and Downside Scenarios to Monitor
Even high-quality cyclicals can reprice quickly when expectations get ahead of fundamentals. Key risks to track:
- Agriculture downside: weaker farm income, lower commodity prices, or tighter farm credit could prolong Large Ag softness (see USDA farm income trends: USDA ERS).
- Construction slowdown: if housing/non-residential indicators deteriorate, equipment demand can fade (track Census construction releases: U.S. Census).
- Used equipment and residual values: falling used prices can reduce trade-in values and pressure new equipment affordability.
- Financing conditions: higher-for-longer rates can reduce buyers’ willingness to finance large purchases and pressure captive finance performance.
- Valuation risk: after a sharp move, even “good” results can lead to a pullback if expectations were extreme.
TL;DR: The biggest threats are a synchronized ag + construction slowdown, weak used equipment pricing, tighter financing, and multiple compression from elevated expectations.
From Deere Stock to Portfolio Construction: Why DE Is a Useful Case Study
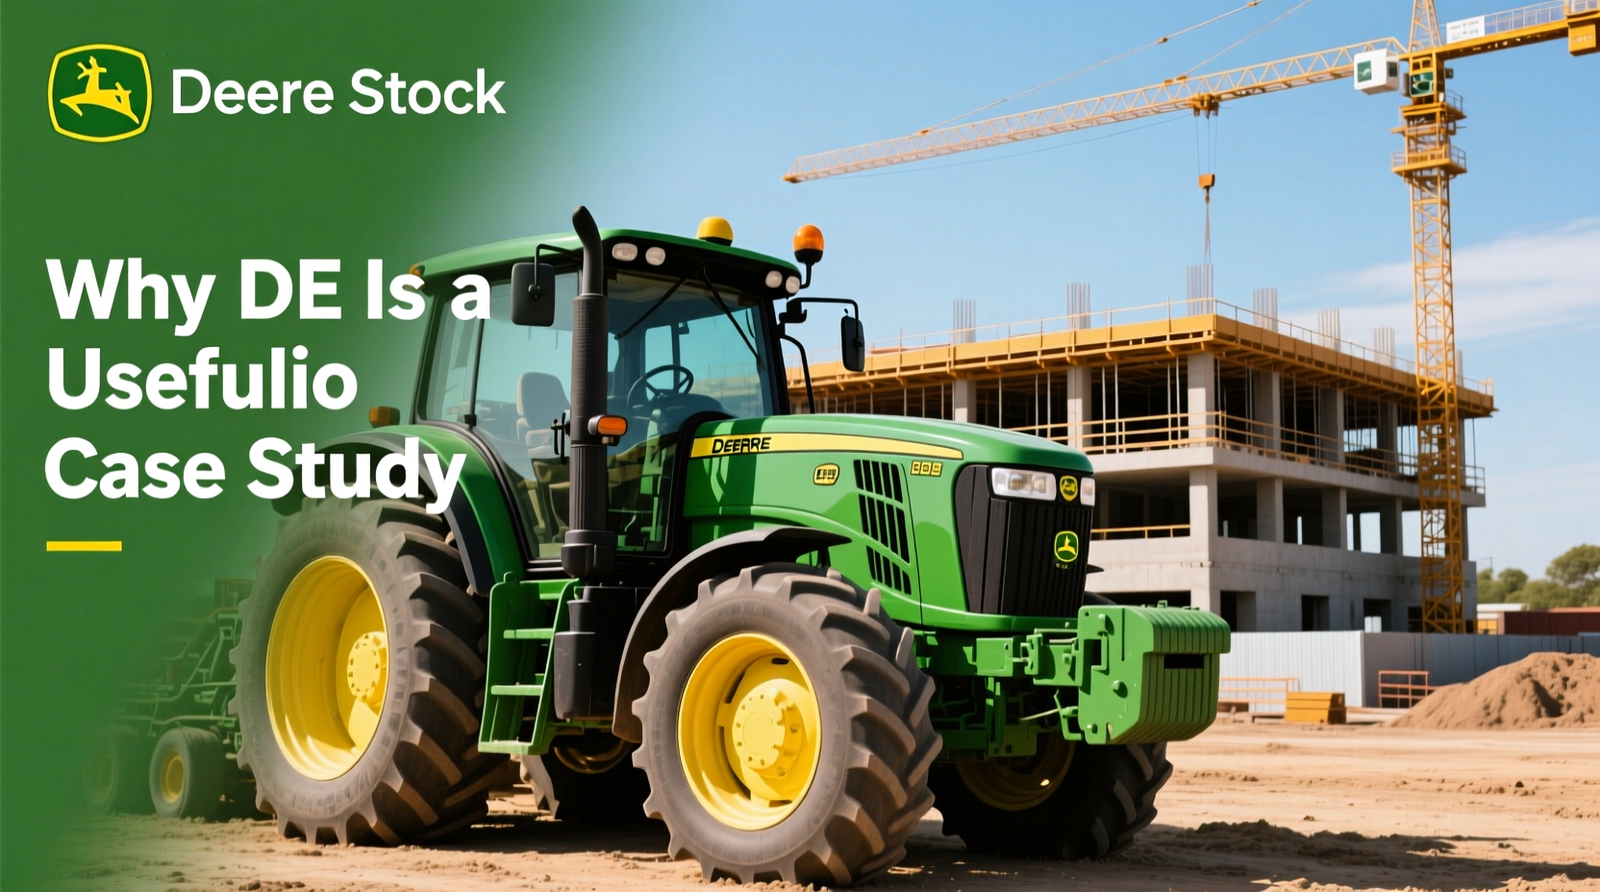
DE is a helpful case study for portfolio design because it sits at the intersection of cyclical demand (ag and construction), technology transformation (precision ag/software), and macro sensitivity (rates, farm income, infrastructure). Those traits make it a good example of why position sizing and diversification matter—especially after a large, catalyst-driven move.
Portfolio Sizing and Diversification: Practical Guardrails
Even if you like the long-term story, Deere is still a cyclical industrial name. Many investors cap single-name cyclicals to limit drawdowns from segment shocks.
- Example sizing (illustrative): conservative investors might limit a single cyclical industrial to ~1%–3% of total portfolio value; moderate risk investors might use ~3%–5%; higher risk tolerance investors may go above that, but should be explicit about why and how they will manage downside.
- Diversification idea: pair cyclicals with less cyclical exposures (e.g., quality defensives, broad index exposure, or bonds depending on objectives) so one macro regime doesn’t dominate outcomes.
- Multi-asset note: some investors add diversifiers like commodities or gold, but allocations should reflect volatility and liquidity needs, not narratives.
TL;DR: Consider capping DE at ~3%–5% for many portfolios (illustrative), diversify cyclicals with less cyclical assets, and size positions based on drawdown tolerance.
Conclusion + Risk Disclaimer

As of the Q1 FY26 earnings release and the subsequent market reaction, Deere’s guidance increase and strong reaction in the stock price suggested investors were assigning higher confidence to earnings durability—helped by Small Ag and Construction strength and the longer-term technology stack in precision ag and software.
Still, after a fast move to record highs, outcomes depend on whether dealer inventories, order trends, used equipment pricing, and financing conditions validate the optimism—and whether valuation remains reasonable versus Deere’s own history and peers (CNH, AGCO, Caterpillar).
Risk disclosure: Future performance is uncertain. This article is for informational purposes only and is not personalized investment advice. Consider your objectives, time horizon, and risk tolerance, and verify all prices/levels/multiples with current data before acting.
TL;DR: Deere’s post-earnings rally looks supported by improved guidance and mix, but elevated expectations increase sensitivity to macro, cycle indicators, and valuation reversion; this is not investment advice.
FAQ
Q: Is Deere (DE) stock overvalued compared with its historical averages?
A: It depends on where DE’s current forward P/E and EV/EBITDA sit relative to its 5–10 year median bands and whether FY26–FY27 earnings prove more durable than prior cycles. After a sharp rally, you should verify live multiples (they change daily) and compare them to long-term multiple charts and to peers like CNH, AGCO, and Caterpillar.
Q: What indicators best confirm that Deere is near a cycle low?
A: Investors typically watch dealer inventory normalization, order backlog trends, used equipment pricing/residual values, and financing conditions. Macro confirmation often comes from USDA farm income trends and construction indicators such as housing starts and construction spending.
Q: What are the most important support levels for DE stock after the breakout?
A: In the post-earnings context discussed, traders commonly focused on $650 as a key psychological/trend level and $600–$615 as a deeper support zone from prior resistance. These levels can shift, so re-check current charts before trading.
Q: How could Deere’s precision agriculture and software strategy change its cyclicality?
A: More connected machines, software tools, and subscription-like services can increase recurring revenue and customer stickiness, which may reduce earnings volatility compared with older equipment-only cycles. However, large equipment demand can still swing with farm income and credit conditions.
Q: How big should a Deere position be in a diversified portfolio?
A: Many investors limit single cyclical industrial stocks to roughly 3%–5% of a portfolio (illustrative) to manage drawdown risk, with smaller caps for conservative profiles. The right size depends on your risk tolerance, time horizon, and how diversified the rest of your holdings are.