Introduction: Global Food Processing Machinery Market Size (2024) and Forecast (2025–2034)

The global food processing machinery market is estimated at USD 71.7 billion in 2024 and is forecast to reach approximately USD 135.9 billion by 2034, reflecting a compound annual growth rate (CAGR) of 8.2% from 2025 to 2034. In 2024, North America led the market with about 36.7% share (approximately USD 26.3 billion).
Scope and definitions: In this report, “food processing machinery” refers to industrial food processing equipment used to transform raw agricultural/animal inputs into standardized food products (e.g., cleaning, cutting, grinding, mixing, cooking, pasteurizing, cooling, and forming). “packaging machinery” refers to equipment that packs food into primary/secondary formats (e.g., filling, sealing, labeling, cartoning, case packing). “utilities and ancillary systems” refers to supporting plant systems such as CIP (cleaning-in-place) skids, compressors, boilers, refrigeration, and wastewater handling. Unless stated otherwise by a specific dataset, the market sizing here reflects spending across processing and packaging machinery categories as presented in the segmentation, and discusses utilities/ancillaries as enabling systems that influence purchasing decisions.
Currency and comparability: All market values are expressed in nominal (current) USD (not inflation-adjusted). Exchange rates and inflation assumptions vary by source; for decision-making, treat multi-year comparisons as directional unless your business case uses a consistent internal inflation/FX model.
Food processors are under pressure to reduce loss, improve hygiene, and increase throughput. The FAO (Food and Agriculture Organization of the United Nations) estimates 13.2% of food is lost between harvest and retail (latest widely cited estimate). Meanwhile, the UNEP (United Nations Environment Programme) Food Waste Index 2024 reports consumer-facing waste remains high, with 1.05 billion tonnes of food wasted in 2022 (retail, food service, and households combined). These figures strengthen the ROI case for hygienic food machinery, better yield control, and packaging that extends shelf life. For reference, see the FAO overview on food loss and waste (FAO: Food loss and food waste) and UNEP’s Food Waste Index (UNEP Food Waste Index Report 2024).
TL;DR: The market is modeled at USD 71.7B (2024) growing to USD 135.9B (2034) at 8.2% CAGR; values are nominal USD, and key terms (processing vs. packaging vs. utilities) are defined upfront.
Regulatory Landscape and Food Safety: How Compliance Drives Equipment Upgrades
Food safety regulation increasingly links directly to machinery design choices. In the United States, FSMA (Food Safety Modernization Act) shifted the industry toward preventive controls, requiring covered facilities to implement hazard analysis and risk-based controls, verification, and records. This accelerates adoption of:
- CIP systems and hygienic design retrofits to standardize sanitation and reduce cross-contamination risk.
- Inline inspection (e.g., metal detection, X-ray, checkweighing, vision systems) to support verification and traceability expectations.
- Aseptic processing and validated thermal processing steps where shelf-stable or extended shelf-life products are critical.
- Data logging and IIoT (Industrial Internet of Things) connectivity to reduce manual records and improve audit readiness.
For the regulatory baseline, see FDA’s FSMA overview (U.S. FDA: FSMA).
Public health impact keeps regulators and brand owners focused on controls that machinery can enforce. The WHO (World Health Organization) estimates unsafe food causes 600 million cases of foodborne disease and 420,000 deaths annually (WHO Food Safety Fact Sheet). In the U.S., the CDC (Centers for Disease Control and Prevention) estimates 48 million illnesses, 128,000 hospitalizations, and 3,000 deaths each year (CDC: Burden of Foodborne Illness). These realities support spending on hygienic food machinery, validated kill steps, and contamination-prevention design.
Clarifying the food price index date issue: The prior draft referenced “December 2025” and “full-year 2025,” which conflicts with a 2024 base year and a 2025–2034 forecast framing. To keep the analysis consistent with what is verifiable today, this section uses the latest completed-year FAO Food Price Index reporting available at the time of writing as context for input-cost volatility, rather than projecting a future “2025 full-year” figure. Readers should consult FAO’s monthly releases for the most current index values (FAO: Food Price Index). The strategic implication remains: volatility in commodities and energy tends to accelerate investments in yield-improving, waste-reducing, and energy-optimized food production equipment.
TL;DR: Regulations like FSMA translate into concrete equipment demand—CIP, inline inspection, aseptic/validated processing, and connected data logging; food safety burdens and input-cost volatility reinforce the upgrade cycle.
Key Market Takeaways (2024 Snapshot)
- Market growth: USD 71.7B (2024) to ~USD 135.9B (2034), 8.2% CAGR (2025–2034).
- Leading function/type: Mixers at ~32.7% share in 2024 (high utilization across bakery, dairy, sauces, beverages).
- Machinery grouping: Processing machinery at ~59.1% share in 2024 (core unit operations drive most capex).
- Operations: Fully automatic systems at ~67.3% share in 2024 (labor constraints + consistency + compliance data).
- Top application: Bakery & confectionery at ~26.8% share in 2024 (high-volume, frequent changeovers).
- Top region by size: North America at ~36.7% share in 2024 (~USD 26.3B), driven by scale and regulation.
Benchmark note: Shares indicate leadership in 2024; the next-largest segments are not provided in the source text, so comparisons are directional (leaders are typically categories with the broadest cross-application deployment).
TL;DR: 2024 leadership centers on mixers, processing machinery, and fully automatic systems, with North America the largest region by spend.
Market Segmentation: Processing vs. Packaging vs. Utilities (What Buyers Actually Specify)
By Equipment Type (Examples)
- Depositors
- Extruding machines
- Mixers
- Refrigeration equipment
- Slicers and dicers
- Others (specialty/custom machinery)
Mixers lead because they are a “common denominator” asset across categories—bakery, dairy, sauces, prepared foods, beverages, and confectionery all rely on controlled mixing for texture, consistency, and yield. For operators, mixer upgrades often unlock immediate benefits such as tighter batch-to-batch uniformity, shorter cycle times, and easier sanitation (particularly when paired with CIP and hygienic design features).
By Machinery Type
- Processing machinery (primary processing, thermal/non-thermal steps, extrusion/forming)
- Packaging machinery (primary/secondary/end-of-line, vacuum, MAP (modified atmosphere packaging), aseptic systems)
- Utilities and ancillary systems (e.g., CIP skids, refrigeration, compressed air, steam, wastewater)
Processing machinery dominates because it directly determines product transformation, safety, and yield. It is also where plants often see the largest OEE (overall equipment effectiveness) gains from modern controls, better hygienic design, and energy-optimized thermal systems. Packaging is critical for shelf-life and branding, but processing capex typically leads when capacity expansion or risk reduction is the priority.
TL;DR: Segmentation matters because buyers specify projects differently: processing drives core transformation and yield, packaging protects shelf-life and distribution performance, and utilities enable hygiene and uptime.
Impact of Automation on Food Processing Machinery Demand (Mode of Operation)

In 2024, fully automatic systems represented about 67.3% of the market by mode of operation. The core driver is not just speed—it is repeatability, audit-ready documentation, and labor risk mitigation in high-throughput environments.
Investment lens (payback and margins): Automation projects in food plants are commonly justified through a combination of labor savings, reduced giveaway (overfill), higher yield, and fewer quality incidents. Payback periods vary widely by product and labor market, but many processors target ~18–36 months for discrete automation (e.g., case packing, palletizing, checkweighing) and may accept longer horizons for line-wide modernization when it also reduces safety/compliance risk. OEMs and integrators typically blend equipment margins with higher-margin aftermarket service (spares, preventive maintenance, upgrades, remote support), making installed base growth strategically important.
TL;DR: Automation demand is driven by repeatability + compliance data + labor availability; many plants seek ~18–36 month payback for targeted automation, with aftermarket services supporting supplier economics.
Bakery and confectionery led with ~26.8% share in 2024 because production is high-frequency and equipment is heavily utilized: mixing, forming, proofing, baking, cooling, enrobing, decorating, and packaging all create continuous demand for upgrades and maintenance.
Other applications (meat, poultry/seafood, dairy, beverages, ready meals) also invest aggressively, often driven by category-specific requirements such as temperature control, allergen management, shelf-life targets, and contamination prevention.
TL;DR: Bakery & confectionery leads due to high utilization and frequent changeovers, while other categories pull demand through safety, shelf-life, and cold-chain requirements.
Emerging Technology Trends: Robotics, Vision Inspection, and IIoT-Enabled Equipment
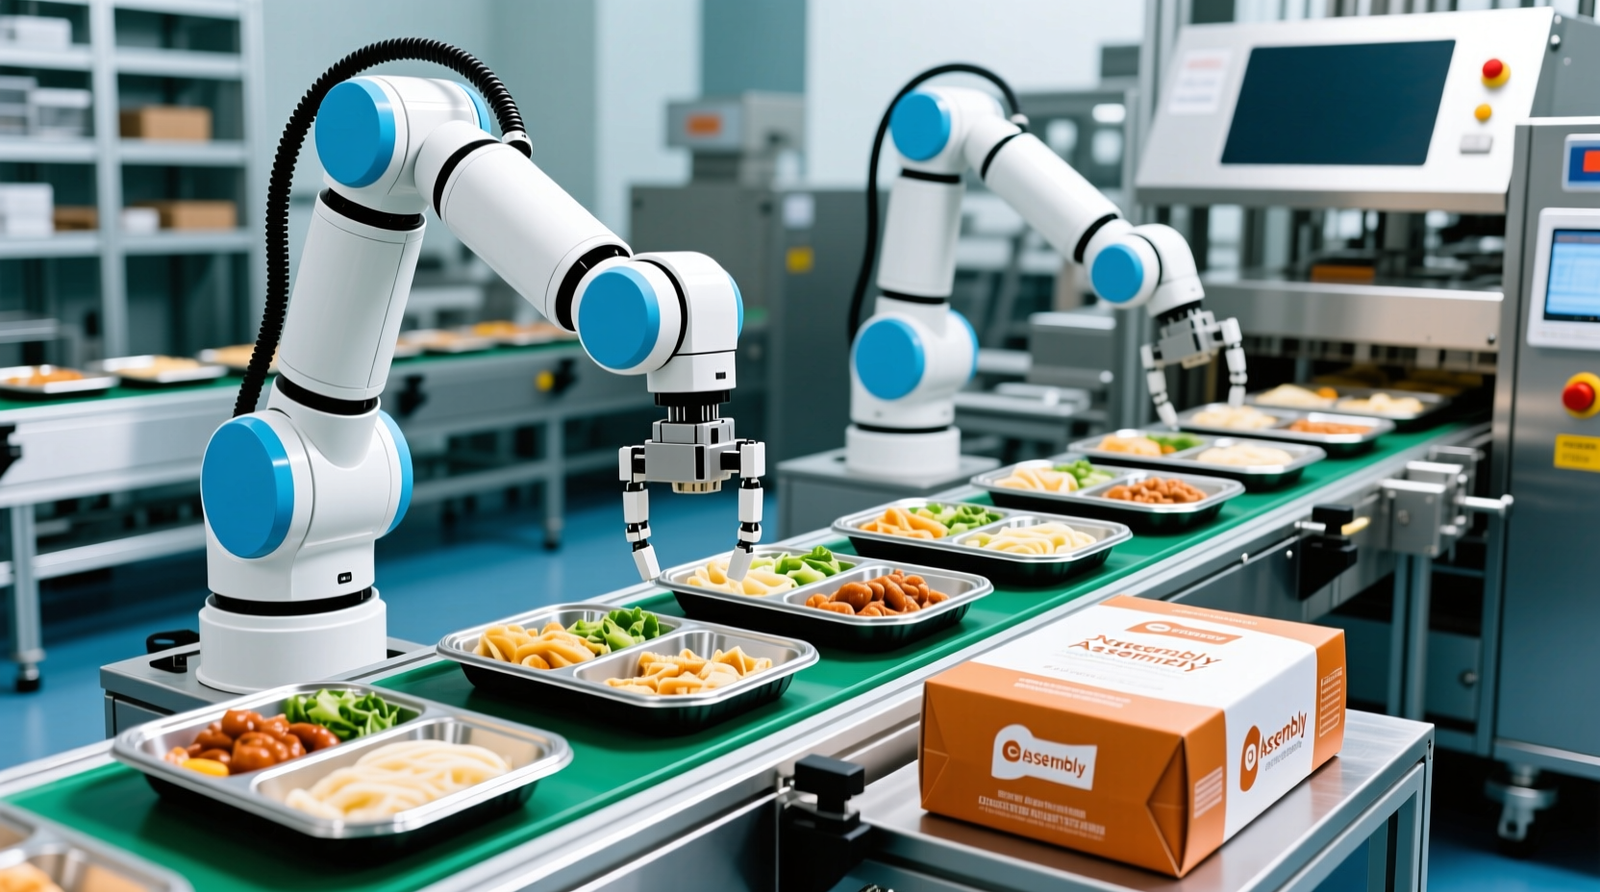
Robotics and smart automation are expanding from end-of-line packaging into more hygienic, washdown-ready handling tasks (portioning, picking, placement), especially for ready-to-eat products. The IFR (International Federation of Robotics) reported 4,281,585 industrial robots operating globally in 2023 (up ~10% year over year), illustrating the broader automation base that food and beverage is increasingly tapping (International Federation of Robotics (IFR)).
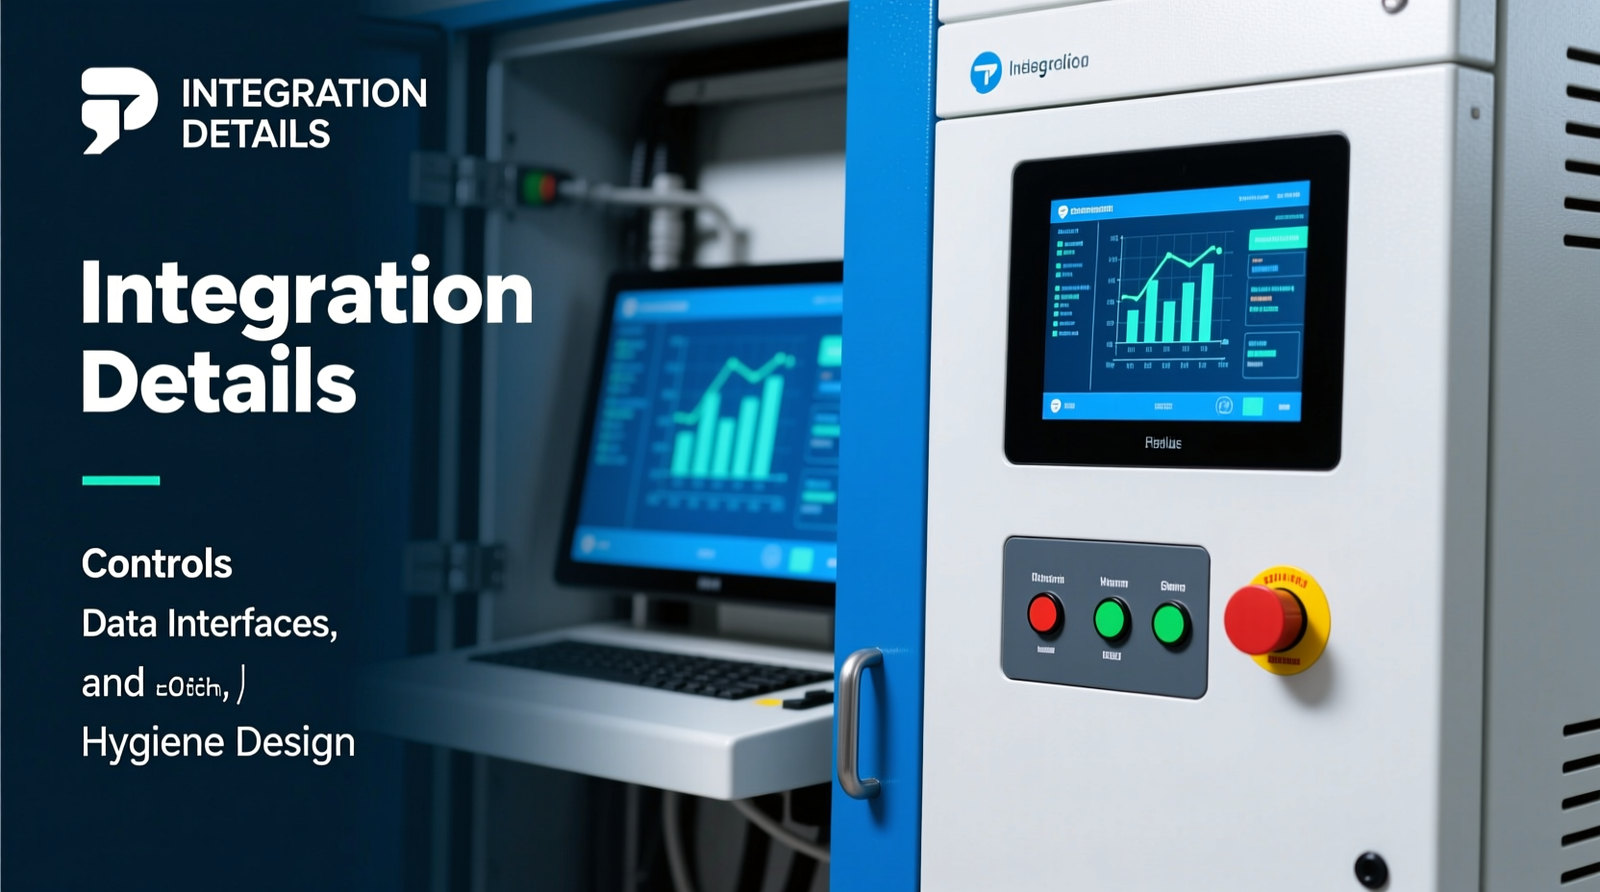
In practical purchasing terms, the strongest pull is for systems that combine:
- Machine vision for inline defect detection and label/print verification
- Connected sensors for temperature/pressure/time validation and predictive maintenance
- Digital traceability aligned to customer and regulatory expectations
These capabilities reduce rework, support compliance, and protect brand quality—without repeating the same benefits in every section, the key point is that “smart” features are increasingly specified as part of the equipment baseline rather than optional add-ons.
TL;DR: Growth technologies include robotics, vision inspection, and IIoT connectivity—purchased primarily for quality control, compliance evidence, and uptime.
Market Drivers: Sustainability, Labor Constraints, and Regulation—Mapped to Machinery Categories
Three macro drivers repeatedly show up in capital plans, and each maps to specific machinery investments:
- Waste reduction and sustainability: The FAO/UNEP loss-and-waste baseline strengthens the case for optical sorting, gentle conveying, precision filling/sealing, and packaging formats that extend shelf life (e.g., MAP). (For full context, see the FAO and UNEP links cited earlier.)
- Labor shortages and ergonomics: Plants accelerate adoption of end-of-line robotics (case packing/palletizing), automated portioning, and conveyors to reduce turnover-sensitive manual tasks.
- Regulatory pressure and customer audits: FSMA and GFSI-aligned audit expectations push hygienic design upgrades, validated thermal processes, allergen control features, and CIP standardization for repeatable sanitation.
Public funding also influences demand. For example, the USDA’s support for expanding meat and poultry processing capacity has encouraged modernization investments among smaller processors (USDA: Meat and Poultry resources), often tied to sanitary design, throughput, and inspection readiness.
TL;DR: Sustainability, labor, and compliance translate into concrete equipment purchases—sorting, hygienic conveyors/CIP, thermal validation, MAP/aseptic packaging, and robotics.
Market Restraints: Capex, Financing, and Administrative Friction (Why Projects Stall)

High upfront costs remain the most cited barrier, particularly for SMEs (small and medium-sized enterprises). Hygienic, automated systems often require not only the machine purchase but also facility upgrades (drainage, utilities, air handling, floors/walls), which expands project scope and stretches payback.
Why the India example matters globally: Administrative requirements tied to lending—such as permits, environmental consents, or documentation prerequisites—are a common reason modernization projects stall in many countries, not only India. The Karnataka/PMFME experience is illustrative of a broader pattern: when compliance paperwork and bank underwriting timelines do not match operational urgency, processors delay upgrades, continue running aging lines, and accept higher downtime and yield loss.
TL;DR: The biggest restraint is not demand—it’s capex + facility readiness + financing friction, with administrative prerequisites often delaying equipment adoption for SMEs worldwide.
Market Opportunities: Emerging-Market Industrialization and Policy-Led Capacity Builds (India as a Case Study)
Across emerging markets, governments are increasingly shifting from “produce more” to “process more locally” to reduce loss, improve farmer realizations, and build export-ready supply chains. India is a useful case study within this broader trend because it combines large agricultural throughput with explicit policy support for value addition.
Programs such as PMKSY (Pradhan Mantri Kisan Sampada Yojana) and PMFME (PM Formalisation of Micro Food Processing Enterprises) are structured to expand processing capacity and formalize micro-enterprises—both of which translate into demand for entry-level and mid-scale food production equipment (mixers, cutters, packaging lines, basic QC) as well as larger infrastructure projects (cold chain, irradiation, testing labs). Where these programs run smoothly, they can create multi-year visibility for OEMs and integrators; where administration or credit slows, they highlight the need for simpler access to finance and standardized compliance pathways.
TL;DR: Emerging-market policy is increasingly pro-processing; India shows how incentives can create real equipment demand, but also how financing and approvals can limit speed of adoption.
Food Processing Machinery Market Size by Region: Leaders vs. Fastest Growth

North America (Largest Market in 2024)
North America led in 2024 with about 36.7% share (~USD 26.3 billion), supported by a large installed base, strong compliance requirements, and consistent reinvestment in automation and hygienic design. Regulatory expectations (e.g., FSMA) and retailer/customer audits make validation-ready equipment and traceability-enabling upgrades a recurring spend category.
Europe, Asia Pacific, Latin America, Middle East & Africa (Growth Context)
- Europe: Mature demand emphasizing energy efficiency, sustainable packaging, and modernization of legacy lines.
- Asia Pacific: Often the fastest-growth region in many industrial equipment markets due to urbanization, capacity builds, and rapid packaged-food expansion—frequently from a smaller per-capita machinery base than North America/Europe.
- Latin America: Growth tied to export-oriented processing and modernization in large agri economies.
- Middle East & Africa: Investment driven by food security strategies, import substitution, and cold-chain expansion.
TL;DR: North America leads in market size (2024), while Asia Pacific is positioned as the key growth engine as capacity and formal processing expand.
Competitive Landscape: Key Players, Consolidation Signals, and Partnership Models
The market is moderately consolidated, combining multinational process-technology groups with specialized hygienic food machinery builders. Key companies include Bühler, GEA, Tetra Laval (Tetra Pak), JBT Marel, Krones, Marel, Alfa Laval, SPX FLOW, Tomra, and Satake.
Competitive dynamics (beyond revenue)
- Consolidation and portfolio expansion: Large suppliers expand “line solution” breadth (processing + packaging + digital) to win turnkey projects and capture lifecycle service revenue.
- Technology partnerships: OEMs increasingly partner with vision/inspection, robotics, and software providers to deliver audit-ready data, predictive maintenance, and remote diagnostics.
- Regional manufacturing and service footprint: Buyers often favor suppliers with local commissioning capability and fast spares availability, especially for high-uptime categories like dairy, beverages, and bakery.
Selected player snapshots (as provided)
GEA Group AG: Reported ~€5.4 billion revenue in fiscal 2024 with a global service footprint, supporting multi-site standardization and aftermarket programs.
JBT Marel: Reported ~USD 1,716 million revenue in 2024, balancing equipment projects with recurring service and parts support.
Krones AG: Reported €5,293.6 million sales in 2024, with strength in beverage/liquid-food lines and turnkey delivery.
Bühler AG: Reported CHF 3.0 billion turnover in 2024 with a strong order book, reflecting sustained demand in grain, extrusion, and related systems.
TL;DR: Competition is shifting toward turnkey line capability + digital/inspection partnerships + lifecycle service, with consolidation supporting broader portfolios and stronger installed-base economics.
Forecast Outlook (2025–2034): What to Watch

- Fastest growth tailwinds: Capacity expansion in Asia Pacific and policy-led builds in emerging markets.
- Technology pull: IIoT-enabled equipment, inline inspection/vision, and robotics—especially end-of-line and hygienic handling.
- Processing focus: Continued capex priority on core processing steps (yield/quality/safety), with packaging upgrades tied to shelf-life and waste reduction.
- Efficiency economics: Projects justified through labor risk reduction, giveaway reduction, yield improvement, and energy optimization.
- Risk and compliance: Higher emphasis on hygienic design and validation-ready systems for audit resilience.
TL;DR: The decade’s winners are likely to be suppliers and plants that combine automation + inspection + hygienic design with strong service support, particularly in faster-growing regions.
Implications for Stakeholders
- OEMs and integrators: Prioritize hygienic design, faster cleanability, inspection/data features, and modular line architectures. Build service and spares capacity near major processing clusters to improve win rates and aftermarket capture.
- Plant operators (processors): Focus capital on the constraints that drive profitability—yield loss, giveaway, downtime, sanitation time, and audit risk. Build ROI models that include facility upgrade costs and target payback ranges appropriate to the risk reduced (often shorter for discrete automation, longer for major line conversions).
- Policymakers and agencies: If the goal is modernization and safer food, simplify access to credit, standardize permitting pathways, and invest in testing/inspection infrastructure that raises baseline compliance and enables export readiness.
TL;DR: OEMs win with hygienic + connected + serviceable equipment, operators win by investing where constraints hit margins, and policymakers accelerate adoption by reducing financing/approval friction.
Methodology Note (Transparency)

Market sizing and forecasts typically combine secondary research (public company reports, trade data, regulator publications, and industry associations) with primary inputs (interviews with OEMs, integrators, and plant operators). Forecasts are commonly developed using a blend of top-down and bottom-up approaches, then triangulated against installed-base replacement cycles, capacity additions, and category growth assumptions.
TL;DR: The estimates are based on standard market research triangulation using primary + secondary sources and cross-checking against capacity, replacement cycles, and adoption trends.
FAQ
Q: What is included in the food processing machinery market—does it include packaging and utilities?
A: In this report, the market discussion covers both processing machinery (core transformation steps) and packaging machinery (filling, sealing, end-of-line). Utilities and ancillary systems (like CIP skids and refrigeration) are discussed as enabling systems; whether they are fully counted in the market total depends on the underlying dataset definition, so buyers should confirm scope when benchmarking vendors.
Q: How does FSMA influence demand for hygienic food machinery?
A: FSMA increases focus on preventive controls, verification, and documentation, which drives investment in hygienic design, CIP-capable equipment, inline inspection, and data logging/traceability features that make sanitation and compliance more repeatable and auditable.
Q: What is a typical payback period for food processing automation projects?
A: It varies by labor cost, throughput, and waste levels, but many plants target ~18–36 months payback for discrete automation (such as case packing, palletizing, or checkweighing). Larger line-wide upgrades may have longer paybacks if they also reduce compliance risk, improve yield materially, or enable new product formats.
Q: Which region is expected to grow fastest in food production equipment demand through 2034?
A: While North America is the largest by current spend, Asia Pacific is often positioned as the fastest-growth region due to capacity expansion, urbanization-driven processed food demand, and modernization of legacy plants—especially when supported by local policy and infrastructure investment.
Q: What future technologies will shape industrial food processing equipment over the next decade?
A: The most impactful technologies include IIoT-connected machinery, machine vision and inline inspection, more robotics in hygienic environments, and continued progress in energy-optimized thermal systems and shelf-life-extending packaging formats (such as MAP and aseptic solutions).